

Unemployment Rate Facts
POSTED BY: JEWELSTAITEFAN
UPDATED: Monday, September 14, 2026 20:17
VIEWED: 54718
PAGE 7 of 10

I'm not sure if you have actually looked at the tables that I've been updating.
Have you?
Quote:This category of Involuntary Part Time employees is a column I have posted/used in Tables 2, 3, and 6. It is also included in the calculation for U-6 Unemployment Rate, which I also post.
Originally posted by 6IXSTRINGJACK:
Lesson summary: Unemployment
https://www.khanacademy.org/economics-finance-domain/ap-macroeconomics
/economic-iondicators-and-the-business-cycle/unemployment/a/lesson-summary-unemployment
Lesson overview
A country’s economic performance is measured using three key indicators, one of which is the unemployment rate. When adults who are willing and able to work cannot find a job, it may be a sign that an economy is producing less than it could. On the other hand, unemployment is also a natural phenomenon that even healthy economies experience. While the official unemployment rate is helpful in representing the state of a nation’s workforce, it does have some shortcomings that should be considered, such as excluding discouraged workers.
[Relevant points to my argument: i.e.: the Correct Argument]
Unemployed - A term that describes a person who could be working, and wants to work, but is not working; to be counted as unemployed you must be part of the eligible population, not working, and actively looking for work.
Discouraged Workers - People who do not have a job, but they will take a job if offered one. However, they have given up looking for work, so they are not counted in the labor force; for example, if Carol gives up looking for work because she is having trouble finding a job, she is no longer in the labor force and therefore is not counted as unemployed.
Underemployed - People who work part-time, but they really want to work full time if they could find a full-time job; for example, Tyreese wants to work full time as an engineer, but he can only find a part-time job.
Quote:
Limitations of the Unemployment Rate:
The unemployment rate as it is measured officially is often criticized for understating the level of joblessness because it excludes anyone working at all or people who aren’t looking for work. In particular, the official unemployment rate leaves out discouraged workers and the underemployed. People who have given up looking for work because they are convinced that they cannot find jobs are considered discouraged workers. Some people are counted as employed because they are working part-time, even though they really want full-time work.
Common Misperceptions:
- Not everyone who is out of work is unemployed. In order to be counted as unemployed you have to be out of work, looking for work, and able to accept a job if one is offered to you. If you are out of work and not looking, then you are considered “not in the labor force” rather than unemployed.
(NOTE: The ONLY way this can be taken into account is by counting weekly unemployment claims. So anybody who just left college and is looking for a job isn't even counted as unemployed... and of those who are filing and counted, the second they can't file another claim because their unemployment benefit ran out, they are no longer counted as unemployed either).
- A decrease in the unemployment rate isn’t necessarily a sign of an improving economy. When people stop looking for jobs and drop out of the labor force as discouraged workers, the unemployment rate will decrease even though the true employment situation hasn’t gotten any better. This is why it is important to look at both changes in the unemployment rate and changes in the labor force participation rate. Looking at both changes let’s you get a more complete idea about changes in the employment situation.
Half the jobs in this country are bullshit, part-time McJobs that offer nothing or next to it in terms of benefits as well as low wages. So even if you throw out Discouraged Workers like your stupid little graph throws out, Second, you've got tens of millions
NOTIFY: Y | REPLY | REPLY WITH QUOTE | PERMALINK | TOP | HOME

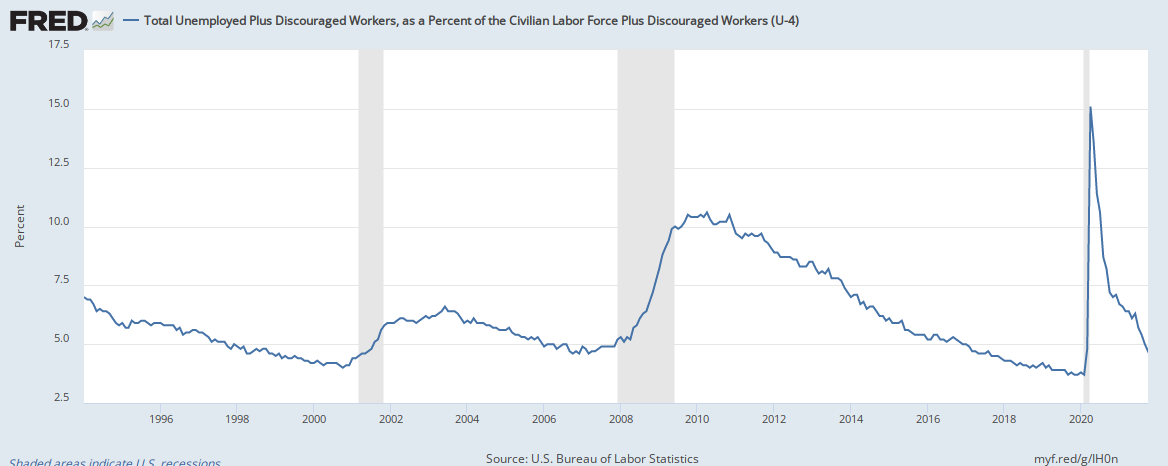
Quote:Total Unemployed Plus Discouraged Workers, as a Percent of the Civilian Labor Force Plus Discouraged Workers (U-4)
Originally posted by 6IXSTRINGJACK:
Lesson summary: Unemployment . . .
https://fred.stlouisfed.org/graph/?g=IH0n
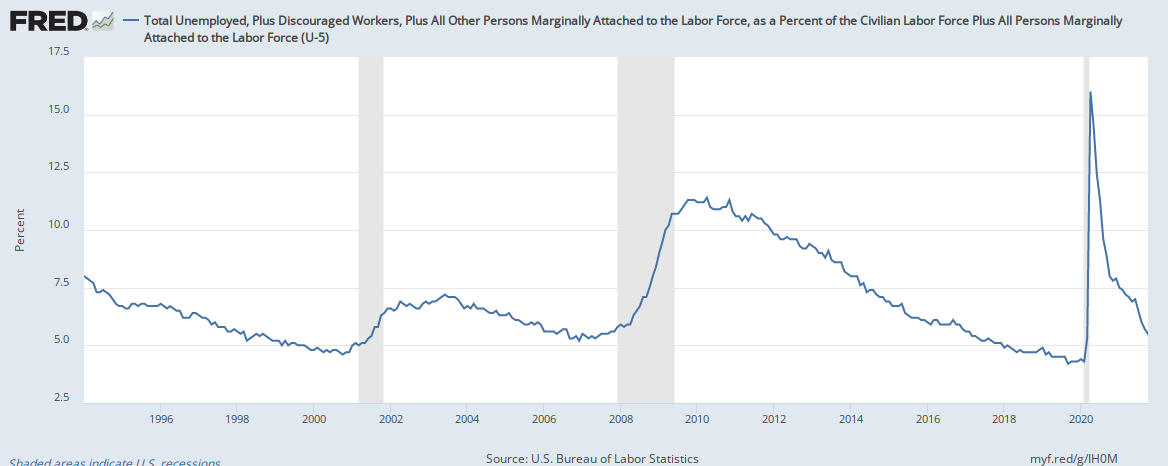
Total Unemployed, Plus Discouraged Workers, Plus All Other Persons Marginally Attached to the Labor Force, as a Percent of the Civilian Labor Force Plus All Persons Marginally Attached to the Labor Force (U-5)
https://fred.stlouisfed.org/graph/?g=IH0M
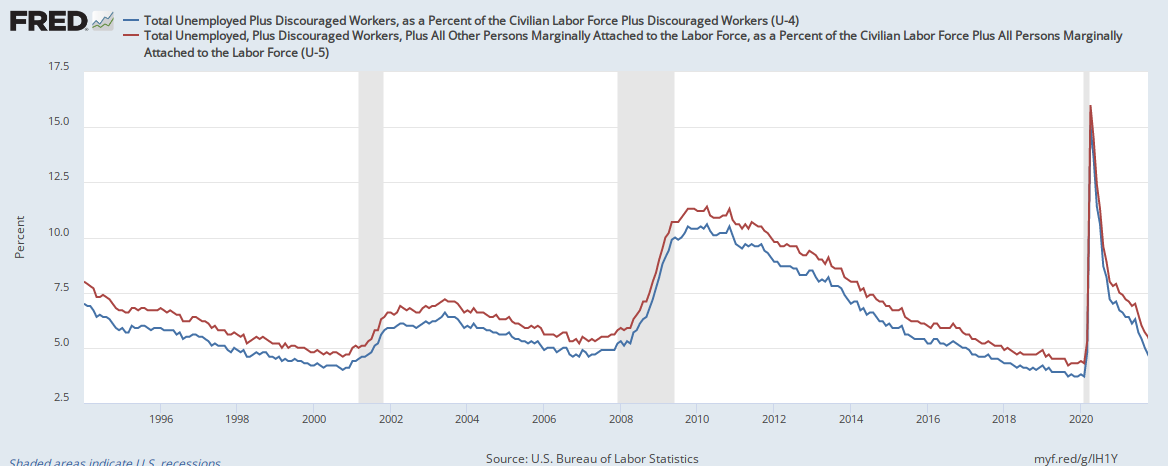
Blue line (U-4)
Red line (U-5)
https://fred.stlouisfed.org/graph/?g=IH1Y
Not in Labor Force - Want a Job Now, Marginally Attached, Discouraged Workers
https://fred.stlouisfed.org/graph/?g=IH0R

The Joss Whedon script for Serenity, where Wash lives, is Serenity-190pages.pdf at https://www.mediafire.com/two
NOTIFY: Y | REPLY | REPLY WITH QUOTE | PERMALINK | TOP | HOME

Quote:
Originally posted by JEWELSTAITEFAN:Quote:This sounds untrue. There are millions who are looking for work, but are not counted among the Labor Force because their Unemployment Benefits have been exhausted. How are you imagining that solely looking for work fits into some category of the Labor Force?
Originally posted by 1KIKI:
AFAIK to be counted as being unemployed you have to be actively receiving unemployment benefits and all the caveats and limitations that imposes.
I hope most people know by now that unemployment numbers are hardly meaningful, and that the labor force participation rate is a better metric. But it's not perfect! It counts "those who are employed or unemployed and looking for work, compared to the total adult population". If you work 1 hour a week, you're counted as employed. If your LOOKING for work, you still count!
It's unclear if Kiki meant what you were saying she meant or not.
But I cleared that up in the following post. Answering YES when asked if you are currently looking for work is a requirement every week you file for unemployment benefits.
But this does bring up a good point. It allows the Media to say something that stupid people would believe. "If you're looking for work, you're counted as unemployed".
Not really. Only if you claimed you were looking for work during the last week you filed for unemployment benefits.
--------------------------------------------------
Vaccinated People: "You need to get muh vaccination shots that don't work because I got muh vaccination shots that don't work and I'm afraid of people that didn't get muh vaccination shots that don't work because muh vaccination shots that don't work don't work."
NOTIFY: Y | REPLY | REPLY WITH QUOTE | PERMALINK | TOP | HOME
Quote:Whether discouraged or looking for work is meaningless unless you live in the 60,000 households surveyed each month. YOU COUNT FOR NOTHING UNLESS YOU LIVE IN THOSE 60,000 HOUSEHOLDS. Most of what happens everyday is unknowable except to the one or two people who were there when it happens, including being employed or not.
Originally posted by 6IXSTRINGJACK:
It's unclear if Kiki meant what you were saying she meant or not.
But I cleared that up in the following post. Answering YES when asked if you are currently looking for work is a requirement every week you file for unemployment benefits.
But this does bring up a good point. It allows the Media to say something that stupid people would believe. "If you're looking for work, you're counted as unemployed".
Not really. Only if you claimed you were looking for work during the last week you filed for unemployment benefits.
The Current Population Survey (CPS) is a monthly survey of about 60,000 U.S. households conducted by the United States Census Bureau for the Bureau of Labor Statistics (BLS). The BLS uses the data to publish reports early each month called the Employment Situation. https://en.wikipedia.org/wiki/Current_Population_Survey
You can get a little understanding of how the Bureau of Labor Statistics goes from 60,000 households in the Current Population Survey (CPS) to a monthly report on unemployment by reading this: https://www.bls.gov/lau/stalt.htm
If you think you have better numbers than the Current Population Survey (CPS) of 60,000 households, you need to tell the world where your better numbers came from.
The Joss Whedon script for Serenity, where Wash lives, is Serenity-190pages.pdf at https://www.mediafire.com/two
NOTIFY: Y | REPLY | REPLY WITH QUOTE | PERMALINK | TOP | HOME

Quote:One of the requirements for continuing to receive unemployment benefits - and therefore be counted as unemployed - if you are eligible in NYS is that you have to PROVABLY show you're looking for work. One way to prove that is to go down to the unemployment office and look through their job listings for a required amount of time. I couldn't say what other states require.
It's unclear if Kiki meant what you were saying she meant or not.
Once those benefits run out, or you fail to keep provably looking for work and are kicked out of the program, the unemployment office treats you like you no longer exist. And it doesn't care - and has no way of knowing - if you're continuing to look for work.
NOTIFY: N | REPLY | REPLY WITH QUOTE | PERMALINK | TOP | HOME
Quote:Exactly. Now you have changed your claim.
Originally posted by 1KIKI:Quote:One of the requirements for continuing to receive unemployment benefits - and therefore be counted as unemployed - if you are eligible in NYS is that you have to PROVABLY show you're looking for work. One way to prove that is to go down to the unemployment office and look through their job listings for a required amount of time. I couldn't say what other states require.
It's unclear if Kiki meant what you were saying she meant or not.
Once those benefits run out, or you fail to keep provably looking for work and are kicked out of the program, the unemployment office treats you like you no longer exist. And it doesn't care - and has no way of knowing - if you're continuing to look for work.
Just because you are looking for work does not make you included as Unemployed.
Looking for work does not matter. Only if you report to the government that you are looking for work does it, and do you count.
NOTIFY: Y | REPLY | REPLY WITH QUOTE | PERMALINK | TOP | HOME
If there were truly a worker shortage, wages would be going up, not down. For all workers, hourly earnings are down 1.3% compared to a year ago. For blue-collar workers, hourly earnings are down 0.5%.
https://jabberwocking.com/wage-growth-has-been-negative-over-the-past-
year/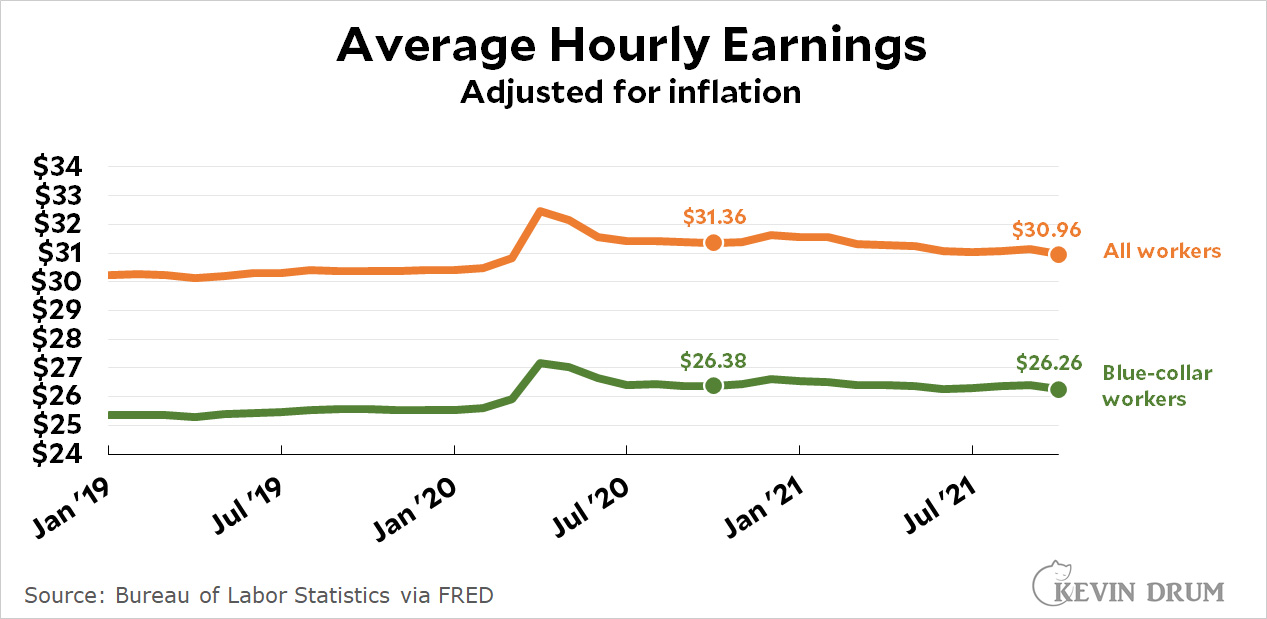
The Joss Whedon script for Serenity, where Wash lives, is Serenity-190pages.pdf at https://www.mediafire.com/two
NOTIFY: Y | REPLY | REPLY WITH QUOTE | PERMALINK | TOP | HOME
JSF, I narrowed my claim, I didn't change it.
Since **I** was taking about unemployment figures and government tallies, I assumed you'd understand that I was talking about figures the government could generate or have access to, for example, when it comes to unemployment, the government's lists of people OFFICIALLY unemployed, according to its rules.
But apparently, you're blind to context, or unable to manage it.
NOTIFY: N | REPLY | REPLY WITH QUOTE | PERMALINK | TOP | HOME

Job creators network suing Biden admin. over vaccine mandate
https://rumble.com/vpg6ra-job-creators-network-suing-biden-admin.-over
-vaccine-mandate.html
Jobless payments in Biden law a roadblock to hiring workers, says business owner at Dem Party event
https://www.bitchute.com/video/JfgeYudvwyUA/
NOTIFY: N | REPLY | REPLY WITH QUOTE | PERMALINK | TOP | HOME
Biden makes trillion-dollar investment in America's future
https://www.koreatimes.co.kr/www/opinion/2021/11/773_319050.html
NOTIFY: N | REPLY | REPLY WITH QUOTE | PERMALINK | TOP | HOME
Updating with Jobs Report data from yesterday:
I will refer to this set of data as Table JSF-URF-1
Jan 2002 is listed twice. First with original report data from February 2002. Second with revised data from new Census data, published in February 2003.
Quote:
Originally posted by JEWELSTAITEFAN:
BLS currently defines the Want A Job category as not being part of the Labor Force.
So I will post some actual numbers and let the comparisons and discussion follow. The documented shenanigans of Obamabots deliberately refusing to Report jobless data in the months before the 2012 Election are a different matter, I will just use the Fake Data they produced and pretend it was real.
I will use only the Unadjusted numbers, to help maintain clarity and transparency.
Mo/Yr Unemp Pcnt WAJb Pcnt SubTtl Pcnt InvPT Pcnt Total Prcnt CivPop LbrFrc Prtc% U-6
Jan98 07069 05.2% 5026 3.7% 12095 08.9% 4090 3.0% 16185 11.9% 204238 135951 66.6 09.3
Jan99 06604 04.8% 4800 3.5% 11404 08.3% 3645 2.6% 15049 10.9% 206719 137943 66.7 08.5
Jan00 06316 04.5% 4354 3.1% 10670 07.6% 3355 2.4% 14025 10.0% 208782 139621 66.9 07.8
Jan01 06647 04.7% 4474 3.2% 11121 07.9% 3559 2.5% 14680 10.4% 210889 141049 66.9 08.1
Jan02 08935 06.3% 4872 3.5% 13807 09.8% 4249 3.0% 18056 12.8% 213089 141074 66.2 10.5
Jan02 09051 06.3% 4938 3.4% 13989 09.8% 4453 3.1% 18442 12.9% 216506 143228 66.2 10.5
Jan03 09395 06.5% 4779 3.3% 14174 09.8% 5003 3.4% 19177 13.2% 219897 145301 66.1 11.0
Jan04 09144 06.3% 4913 3.4% 14057 09.6% 5152 3.5% 19209 13.2% 222161 146068 65.7 10.9
Jan05 08444 05.7% 5136 3.5% 13580 09.2% 4793 3.3% 18373 12.5% 224837 147125 65.4 10.2
Jan06 07608 05.1% 5095 3.4% 12703 08.5% 4513 3.0% 17216 11.5% 227553 149090 65.5 09.2
Jan07 07649 05.0% 4633 3.0% 12282 08.1% 4620 3.0% 16902 11.1% 230650 151924 65.9 09.1
Jan08 08221 05.4% 4977 3.2% 13198 08.6% 5235 3.5% 18433 12.1% 232616 152828 65.7 09.9
Jan09 13009 08.5% 5866 3.8% 18875 12.3% 8675 5.7% 27550 18.0% 234739 153445 65.4 15.4
Jan10 16147 10.6% 6108 4.0% 22255 14.6% 9161 5.9% 31416 20.5% 236832 152957 64.6 18.0
Jan11 14937 09.8% 6643 4.3% 21580 14.1% 9027 6.0% 30607 20.1% 238704 152536 63.9 17.3
Jan12 13541 08.8% 6495 4.3% 20036 13.1% 8747 5.7% 28783 18.8% 242269 153485 63.4 16.2
Jan13 13181 08.5% 6781 4.4% 19962 12.9% 8506 5.5% 28468 18.4% 244663 154794 63.3 15.4
Jan14 10855 07.0% 6508 4.2% 17363 11.2% 7617 5.0% 24980 16.2% 246915 154381 62.5 13.5
Jan15 09498 06.1% 6467 4.1% 15965 10.2% 7125 4.6% 23090 14.8% 249723 156050 62.5 12.0
Jan16 08309 05.3% 6166 3.9% 14475 09.2% 6234 4.0% 20709 13.2% 252397 157347 62.3 10.5
Jan17 08149 05.1% 5934 3.8% 14083 08.9% 6127 3.8% 20210 12.7% 254082 158676 62.5 10.1
Jan18 07189 04.5% 5364 3.3% 12553 07.8% 5380 3.4% 17933 11.2% 256780 160037 62.3 08.9
Jan19 07140 04.4% 5435 3.4% 12575 07.8% 5543 3.4% 18118 11.2% 258239 162104 62.8 08.8
Jan20 06504 04.0% 5107 3.1% 11611 07.1% 4605 2.8% 16216 09.9% 259502 163497 63.0 07.7
Jan21 10851 06.8% 7129 4.5% 17980 11.3% 6284 3.9% 24264 15.2% 260851 159234 61.0 12.0
Jan18 07189 04.5% 5364 3.3% 12553 0
NOTIFY: Y | REPLY | REPLY WITH QUOTE | PERMALINK | TOP | HOME
Updating with today's Jobs Report to this Table of Data, which seems to best show the components of U6:
I will refer to this set of data as Table JSF-URF-2
Note: this year the Marginally Attached data is in Table A-16 of the report.
Quote:
I will post some actual numbers and let the comparisons and discussion follow. The documented shenanigans of Obamabots deliberately refusing to Report jobless data in the months before the 2012 Election are a different matter, I will just use the Fake Data they produced and pretend it was real.
The BLS uses both Seasonally Adjusted figures and Unadjusted figures, and interchanges them without clearly identifying so. For example, the current Rate of 4.1% (for 4 months straight) is SeasAdj, and the real Rate is 4.5% for Jan 2018. I will use only the Unadjusted numbers, to help maintain clarity and transparency.
Some numbers may have a 0 placed as first digit, to maintain column form in this format.
The 1st column of numbers is the unemployed. The 2nd column is the Rate.
The 3rd column is what is called Marginally Attached to the Labor Force, which is included in the Want A Job Now category but NOT included in the Labor Force category and therefore excluded from the reported Unemployment category. The 5th column is the sum of Unemployed plus Marginally Attached - which more accurately represents the Actual Unemployed. The 6th column is the Rate for column 5 figure.
The 7th column is the Involuntary Part-Time workers, who are Not Employed Full Time due to poor Economy, and want, are able to work FT. The 8th column is the Rate for column 7. The 9th column is the sum of the 5th column plus 7th column. 10th column is the Rate for column 9 figure. The Rates in columns 2, 4, 6, 8, 10 have the denominator of Labor Force.
The 11th column is the Civilian Population. 12th column is Labor Force, 13th column is Participation Rate. 14th column is the published U-6 figure.
Figures in thousands.
MoYr Unemp Pct MrgAt Pct SbTtl Pct InvPT Pct Total Pcnt CivPop LbrFrc Prtc% U6%
Ja93 09911 07.9 2120 1.6 11612 09.0 6181 4.9 16575 12.8 192644 126034 65.4
Ja94 09492 07.3 2120 1.6 11612 09.0 4963 3.8 16575 12.8 195953 129393 66.0
Ja95 08101 06.2 1783 1.4 09884 07.6 4620 3.5 14504 11.1 197753 130698 66.1
Ja96 08270 06.3 1737 1.3 10007 07.6 4103 3.1 14110 10.7 199634 131396 65.8 10.8
Ja97 07933 05.9 1615 1.2 09548 07.1 4338 3.2 13886 10.3 202285 134317 66.4 10.4
Ja98 07069 05.2 1479 1.1 08548 06.3 4090 3.0 12638 09.3 204238 135951 66.6 09.3
Ja99 06604 04.8 1358 1.0 07962 05.8 3645 2.6 11607 08.4 206719 137943 66.7 08.5
Ja00 06316 04.5 1197 0.9 07513 05.4 3355 2.4 10868 07.8 208782 139621 66.9 07.8
Ja01 06647 04.7 1290 0.9 07937 05.6 3559 2.5 11496 08.2 210889 141049 66.9 08.1
Ja02 08935 06.3 1509 1.1 10444 07.4 4249 3.0 14693 10.4 213089 141074 66.2 10.5
Ja02 09051 06.3 1532 1.1 10583 07.4 4453 3.1 15036 10.5 216506 143228 66.2 10.5
Ja03 09395 06.5 1598 1.1 10993 07.6 5003 3.4 15996 11.0 219897 145301 66.1 11.0
Ja04 09144 06.3 1670 1.1 10814 07.4 5152 3.5 15966 10.9 222161 146068 65.7 10.9
Ja05 08444 05.7 1804 1.2 10248 07.0 4793 3.3 15041 10.2 224837 147125 65.4 10.2
Ja06 07608 05.1 1644 1.1 09252 06.2 4513 3.0 13765 09.2 227553 149090 65.5 09.2
Ja07 07649 05.0 1577 1.0 09226 06.1 4620 3.0 13846 09.1 230650 151924 65.9 09.1
Ja08 08221 05.4 1729 1.1 09950 06.5 5235 3.4 15185 09.9 232616 152828 65.7 09.9
Ja09 13009 08.5 2130 1.4 15139 09.9 8675 5.6 23814 15.5 234739 153445 65.4 15.4
Ja10 16147 10.6 2539 1.6 18686 12.2 9161 6.0 27847 18.2 236832 152957 64.6 18.0
Ja11 14937 09.8 2800 1.8 17737 11.6 9027 5.9 26764 17.5 238704 152536 63.9 17.3
Ja12 13541 08.8 2809 1.9 16350 10.7 8747 5.7 25097 16.4 242269 153485 63.4 16.2
Ja13 13181 08.5 2443 1.6 15624 10.1 8506 5.5 24130 15.6 244663 154794 63.3 15.4
Ja14 10855 07.0 2592 1.7 13447 08.7 7617 4.9 2106
NOTIFY: Y | REPLY | REPLY WITH QUOTE | PERMALINK | TOP | HOME
This Table of Data, which includes Not Fully Employed Rate.
I will refer to this set of data as Table JSF-URF-3
I will post some actual numbers and let the comparisons and discussion follow.
The BLS uses both Seasonally Adjusted figures and Unadjusted figures, and interchanges them without clearly identifying so. I will use only the Unadjusted numbers, to help maintain clarity and transparency.
Some numbers may have a 0 placed as first digit, to maintain column form in this format.
The 1st column of numbers is the Unemployed.
The 2nd column is what is called Marginally Attached to the Labor Force, which is included in the Want A Job Now category but NOT included in the Labor Force category and therefore excluded from the reported Unemployment category.
The 3rd column is the Involuntary Part-Time workers, who are Not Employed Full Time due to poor Economy, and want, are able to work FT. The 4th column of numbers is the sum of the 1st, 2nd, and 3rd columns. 5th column is the Rate for column 4 figure, divided by Labor Force.
The 6th column of numbers is the Subtotal of columns 1 and 3, Unemployed plus Involuntary Part-Time.
The 7th column is Labor Force minus column 6. This is also Employed minus column 3 Involuntary Part-Time. This is not a figure identified by BLS, so I will call it Actually Fully Employed. This is Employed Full-time plus Voluntary Part-Time.
Not listed, but Civilian noninstitutional Population minus Actually Fully Employed is also a figure avoided by BLS, and I will call it Not Fully Employed, which is Unemployed plus Involuntary Part-Time plus Marginally Attached plus Not In Labor Force. The 8th column is Not Fully Employed Rate, which is divided by Civilian noninstitutional Population.
The 9th column is the Civilian Population. 10th column is Labor Force, 11th column is Participation Rate. 12th column is the published U-6 figure.
Figures in thousands.
Mo/Yr Unem MrgAt InvPT Totl Prct SbTtl AcEmpl NotEm CivPop LbrForc Prtc% U6%
Jan94 09492 2120 4963 16575 12.8 14455 114938 41.3% 195953 129393 66.0
Jan95 08101 1783 4620 14504 11.1 12721 117923 40.4% 197753 130698 66.1
Jan96 08270 1737 4103 14110 10.7 12373 119023 40.4% 199634 131396 65.8 10.8
Jan97 07933 1615 4338 13886 10.3 12271 122046 39.7% 202285 134317 66.4 10.4
Jan98 07069 1479 4090 12638 09.3 11159 124798 38.9% 204238 135951 66.6 09.3
Jan99 06604 1358 3645 11607 08.4 10249 127694 38.2% 206719 137943 66.7 08.5
Jan00 06316 1197 3355 10868 07.8 09671 129950 37.8% 208782 139621 66.9 07.8
Jan01 06647 1290 3559 11496 08.2 10206 130843 38.0% 210889 141049 66.9 08.1
Jan02 08935 1509 4249 14693 10.4 13184 127890 40.0% 213089 141074 66.2 10.5
Jan02 09051 1532 4453 15036 10.5 13504 129724 40.1% 216506 143228 66.2 10.5
Jan03 09395 1598 5003 15996 11.0 14398 130903 40.5% 219897 145301 66.1 11.0
Jan04 09144 1670 5152 15966 10.9 14296 131772 40.7% 222161 146068 65.7 10.9
Jan05 08444 1804 4793 15041 10.2 13237 133888 40.5% 224837 147125 65.4 10.2
Jan06 07608 1644 4513 13765 09.2 12122 136978 39.8% 227553 149090 65.5 09.2
Jan07 07649 1577 4620 13846 09.1 12269 139655 39.5% 230650 151924 65.9 09.1
Jan08 08221 1729 5235 15185 09.9 13456 139372 40.1% 232616 152828 65.7 09.9
Jan09 13009 2130 8675 23814 15.5 21684 131761 43.9% 234739 153445 65.4 15.4
Jan10 16147 2539 9161 27847 18.2 25308 127649 46.1% 236832 152957 64.6 18.0
Jan11 14937 2800 9027 26764 17.5 23964 128572 46.1% 238704 152536 63.9 17.3
Jan12 13541 2809 8747 25097 16.4 22288 131197 45.8% 242269 153485 63.4 16.2
Jan13 13181 2443 8506 24130 15.6 21687 133107 45.6% 244663 154794 63.3 15.4
Jan14 10855 2592 7617 21064 13.6 18472 135909 45.0% 246915 154381 62.5 13.5
Jan15 09498 2234 7125 1885
NOTIFY: Y | REPLY | REPLY WITH QUOTE | PERMALINK | TOP | HOME
The shadowstats site is lean on actual data, requiring a subscription to access what it claims as database.
However, I will make attempt to add in some of the data it presents. This does make assumption that their methodology and counting methods are valid, which I cannot find clear information about.
There also may be comingling of Seasonally Adjusted figures from shadowstats without clarity, but this will be the only series of Tables I post which veer from Not Seasonally Adjusted figures.
The charts they present do show that Unemployment under Trump is better than any time under Obamanomics, so it may be a worthwhile endeavor to investigate.
I will refer to this set of data as Table JSF-URF-5
I will post some actual numbers and let the comparisons and discussion follow. The documented shenanigans of Obamabots deliberately refusing to Report jobless data in the months before the 2012 Election are a different matter, I will just use the Fake Data they produced and pretend it was real.
The 1st column of numbers is the unemployed. The 2nd column is the Rate.
The 3rd column is the sum of the Unemployed plus Marginally Attached plus Involuntary Part-time. 4th column is the Rate for column 3 figure. The Rates in columns 2 and 4 have the denominator of Labor Force.
The 5th column is the Civilian Population. 6th column is Labor Force, 7th column is Participation Rate. 8th column is the published U-6 figure.
The 9th column is the Real Unemployment figure, as presented by shadowstats. The 10th column is the underreported, the difference between the U-6 figure from BLS and the Real figure from shadowstats.
Figures in thousands.
MoYr Unem Pcnt Total Prcnt CivPop LbrForc Prtc% U6% Real Separation
Ja93 09911 07.9 16575 12.8 192644 126034 65.4
Ja94 09492 07.3 16575 12.8 195953 129393 66.0 12% 15.3% 2.3%
Ja95 08101 06.2 14504 11.1 197753 130698 66.1 10% 13.5% 3.5%
Ja96 08270 06.3 14110 10.7 199634 131396 65.8 10.8% 13.5% 2.7%
Ja97 07933 05.9 13886 10.3 202285 134317 66.4 10.4% 13% 2.6%
Ja98 07069 05.2 12638 09.3 204238 135951 66.6 09.3% 12% 2.7%
Ja99 06604 04.8 11607 08.4 206719 137943 66.7 08.5% 11.5% 3.0%
Ja00 06316 04.5 10868 07.8 208782 139621 66.9 07.8% 11% 3.2%
Ja01 06647 04.7 11496 08.2 210889 141049 66.9 08.1% 10.5% 2.4%
Ja02 08935 06.3 14693 10.4 213089 141074 66.2 10.5% 13% 2.5%
Ja02 09051 06.3 15036 10.5 216506 143228 66.2 10.5% 13% 2.5%
Ja03 09395 06.5 15996 11.0 219897 145301 66.1 11.0% 13% 2.0%
Ja04 09144 06.3 15966 10.9 222161 146068 65.7 10.9% 14% 3.1%
Ja05 08444 05.7 15041 10.2 224837 147125 65.4 10.2% 13% 2.8%
Ja06 07608 05.1 13765 09.2 227553 149090 65.5 09.2% 12% 2.8%
Ja07 07649 05.0 13846 09.1 230650 151924 65.9 09.1% 12% 2.9%
Ja08 08221 05.4 15185 09.9 232616 152828 65.7 09.9% 13% 3.1%
Ja09 13009 08.5 23814 15.5 234739 153445 65.4 15.4% 20% 4.6%
Ja10 16147 10.6 27847 18.2 236832 152957 64.6 18.0% 22% 4.0%
Ja11 14937 09.8 26764 17.5 238704 152536 63.9 17.3% 22.5% 5.2%
Ja12 13541 08.8 25097 16.4 242269 153485 63.4 16.2% 22.5% 6.3%
Ja13 13181 08.5 24130 15.6 244663 154794 63.3 15.4% 23% 7.6%
Ja14 10855 07.0 21064 13.6 246915 154381 62.5 13.5% 23.5% 10%
Ja15 09498 06.1 18857 12.1 249723 156050 62.5 12.0% 23.5% 11.5%
Ja16 08309 05.3 16632 10.6 252397 157347 62.3 10.5% 23% 12.5%
Ja17 08149 05.1 16028 10.1 254082 158676 62.5 10.1% 23% 12.9%
Ja18 07189 04.5 14222 08.9 256780 160037 62.3 08.9% 22% 13.1%
Ja19 07140 04.4 14297 08.8 258239 162104 62.8 08.8% 21.8% 13.0%
Ja20 06504 04.0 12573 07.7 259502 163497 63.0 07.7% 21.0% 13.3%
Ja21 10851 06.8 19188 12.1 260851 159234 61.0 12.0% 25.7% 13.7%
Ja18 07189 04.5 14222 08.9 256780 160037 62.3 08.9% 22% 13.1%
Fb18 07091 04.4 13934 08.6 256934
NOTIFY: Y | REPLY | REPLY WITH QUOTE | PERMALINK | TOP | HOME
This Table of Data, which breaks down the numerical changes in the key figures.
I will refer to this set of data as Table JSF-URF-6
I will post some actual numbers and let the comparisons and discussion follow.
The BLS uses both Seasonally Adjusted figures and Unadjusted figures, and interchanges them without clearly identifying so. I will use only the Unadjusted numbers, to help maintain clarity and transparency.
Some numbers may have a 0 placed as first digit, to maintain column form in this format.
The 1st column is Labor Force minus both Unemployed and Involuntary Part-Time. This is also Employed minus Involuntary Part-Time. This is not a figure identified by BLS, so I will call it Actually Fully Employed. This is Employed Full-time plus Voluntary Part-Time.
Not listed, but Civilian noninstitutional Population minus Actually Fully Employed is also a figure avoided by BLS, and I will call it Not Fully Employed, which is Unemployed plus Involuntary Part-Time plus Marginally Attached plus Not In Labor Force. The 2nd column is Not Fully Employed Rate, which is divided by Civilian noninstitutional Population.
The 3rd column is the Civilian Population. 4th column is Labor Force, 5th column is Participation Rate.
After the separation bar, the 7th column is the Increase in Civilian Population from the previous entry. For the entries by year, this is the 12 month Increase. For the entries broken down by month, this is the 1 month Increase.
The 8th column is the Increase in Labor Force from the previous entry.
The 9th column is the Increase in Actually Fully Employed count, from the previous entry.
In the monthly breakdown for 2018, after the second separation bar, the 10th column is the Civilian Population Increase from the entry 12 months prior.
The 11th column is the Labor Force Increase from the entry 12 months prior.
The 12th column is the Actually Fully Employed Increase from the entry 12 months prior.
The 13th column is the amount that the 12th column exceeds the 10th column, or the amount of Unemployed that is being chipped away, despite manipulation of other figures.
Figures in thousands.
Mo/Yr AcEmpl NtEm CiviPop LbrFrc Prtc% | CPIn LFIn AEInc
Jan94 114938 41.3% 195953 129393 66.0% |
Jan95 117923 40.4% 197753 130698 66.1% | 1800 1305 02985/+1185
Jan96 119023 40.4% 199634 131396 65.8% | 1881 0698 01100/-0781
Jan97 122046 39.7% 202285 134317 66.4% | 2651 2921 03023/+0372
Jan98 124798 38.9% 204238 135951 66.6% | 1953 1634 02752/+0799
Jan99 127694 38.2% 206719 137943 66.7% | 2481 1992 02896/+0415
Jan00 129950 37.8% 208782 139621 66.9% | 2063 1678 02256/+0193
Jan01 130843 38.0% 210889 141049 66.9% | 2107 1428 00893/-1214
Jan02 127890 40.0% 213089 141074 66.2% | 2200 0025 -2953/-5153
Jan02 129724 40.1% 216506 143228 66.2% | 5617 2179 -1119/-6736
Jan03 130903 40.5% 219897 145301 66.1% | 3391 2073 01179/-2212
Jan04 131772 40.7% 222161 146068 65.7% | 2264 0767 00869/-1395
Jan05 133888 40.5% 224837 147125 65.4% | 2676 1057 02116/-0560
Jan06 136978 39.8% 227553 149090 65.5% | 2716 1965 03090/+0374
Jan07 139655 39.5% 230650 151924 65.9% | 3097 2834 02677/-0420
Jan08 139372 40.1% 232616 152828 65.7% | 1966 0904 -0283/-2249
Jan09 131761 43.9% 234739 153445 65.4% | 2123 0617 -7611/-9734
Jan10 127649 46.1% 236832 152957 64.6% | 2093 -488 -4112/-6205
Jan11 128572 46.1% 238704 152536 63.9% | 1872 -421 00923/-0949
Jan12 131197 45.8% 242269 153485 63.4% | 3565 0949 02625/-0940
Jan13 133107 45.6% 244663 154794 63.3% | 2394 1309 01910/-0484
Jan14 135909 45.0% 246915 154381 62.5% | 2252 -413 02802/+0550
Jan15 139427 44.2% 249723 156050 62.5% | 2808 1669 03518/+0710
Jan16 142804
NOTIFY: Y | REPLY | REPLY WITH QUOTE | PERMALINK | TOP | HOME
I've heard it said that there are not enough jobs to employ all Americans.
On the other hand, during Trump's presidency, we were deluged with reports of the number of unfilled job openings exceeding the number of unemployed.
These seem to be opposing statements.
The Census recently released another report.
For the figures dated 1 July 2021.
22.3% of the population is under 18 years old.
16.5% of the population is 65 years or older.
331,893,745 is the population count, not including Puerto Rico.
74,012,305 are under 18.
54,762,468 are 65 or older.
261,469 K is the Civilian Population for July 2021. Which is age 16 & older.
So 206,707 K of the Civ Pop are below retirement age.
162,817 K was the Labor Force count for July 2021.
Difference of 43,890 K.
NOTIFY: Y | REPLY | REPLY WITH QUOTE | PERMALINK | TOP | HOME
Updating with Jobs Report data from today:
I will refer to this set of data as Table JSF-URF-1
Jan 2002 is listed twice. First with original report data from February 2002. Second with revised data from new Census data, published in February 2003.
Quote:
Originally posted by JEWELSTAITEFAN:
BLS currently defines the Want A Job category as not being part of the Labor Force.
So I will post some actual numbers and let the comparisons and discussion follow. The documented shenanigans of Obamabots deliberately refusing to Report jobless data in the months before the 2012 Election are a different matter, I will just use the Fake Data they produced and pretend it was real.
I will use only the Unadjusted numbers, to help maintain clarity and transparency.
Mo/Yr Unemp Pcnt WAJb Pcnt SubTtl Pcnt InvPT Pcnt Total Prcnt CivPop LbrFrc Prtc% U-6
Jan98 07069 05.2% 5026 3.7% 12095 08.9% 4090 3.0% 16185 11.9% 204238 135951 66.6 09.3
Jan99 06604 04.8% 4800 3.5% 11404 08.3% 3645 2.6% 15049 10.9% 206719 137943 66.7 08.5
Jan00 06316 04.5% 4354 3.1% 10670 07.6% 3355 2.4% 14025 10.0% 208782 139621 66.9 07.8
Jan01 06647 04.7% 4474 3.2% 11121 07.9% 3559 2.5% 14680 10.4% 210889 141049 66.9 08.1
Jan02 08935 06.3% 4872 3.5% 13807 09.8% 4249 3.0% 18056 12.8% 213089 141074 66.2 10.5
Jan02 09051 06.3% 4938 3.4% 13989 09.8% 4453 3.1% 18442 12.9% 216506 143228 66.2 10.5
Jan03 09395 06.5% 4779 3.3% 14174 09.8% 5003 3.4% 19177 13.2% 219897 145301 66.1 11.0
Jan04 09144 06.3% 4913 3.4% 14057 09.6% 5152 3.5% 19209 13.2% 222161 146068 65.7 10.9
Jan05 08444 05.7% 5136 3.5% 13580 09.2% 4793 3.3% 18373 12.5% 224837 147125 65.4 10.2
Jan06 07608 05.1% 5095 3.4% 12703 08.5% 4513 3.0% 17216 11.5% 227553 149090 65.5 09.2
Jan07 07649 05.0% 4633 3.0% 12282 08.1% 4620 3.0% 16902 11.1% 230650 151924 65.9 09.1
Jan08 08221 05.4% 4977 3.2% 13198 08.6% 5235 3.5% 18433 12.1% 232616 152828 65.7 09.9
Jan09 13009 08.5% 5866 3.8% 18875 12.3% 8675 5.7% 27550 18.0% 234739 153445 65.4 15.4
Jan10 16147 10.6% 6108 4.0% 22255 14.6% 9161 5.9% 31416 20.5% 236832 152957 64.6 18.0
Jan11 14937 09.8% 6643 4.3% 21580 14.1% 9027 6.0% 30607 20.1% 238704 152536 63.9 17.3
Jan12 13541 08.8% 6495 4.3% 20036 13.1% 8747 5.7% 28783 18.8% 242269 153485 63.4 16.2
Jan13 13181 08.5% 6781 4.4% 19962 12.9% 8506 5.5% 28468 18.4% 244663 154794 63.3 15.4
Jan14 10855 07.0% 6508 4.2% 17363 11.2% 7617 5.0% 24980 16.2% 246915 154381 62.5 13.5
Jan15 09498 06.1% 6467 4.1% 15965 10.2% 7125 4.6% 23090 14.8% 249723 156050 62.5 12.0
Jan16 08309 05.3% 6166 3.9% 14475 09.2% 6234 4.0% 20709 13.2% 252397 157347 62.3 10.5
Jan17 08149 05.1% 5934 3.8% 14083 08.9% 6127 3.8% 20210 12.7% 254082 158676 62.5 10.1
Jan18 07189 04.5% 5364 3.3% 12553 07.8% 5380 3.4% 17933 11.2% 256780 160037 62.3 08.9
Jan19 07140 04.4% 5435 3.4% 12575 07.8% 5543 3.4% 18118 11.2% 258239 162104 62.8 08.8
Jan20 06504 04.0% 5107 3.1% 11611 07.1% 4605 2.8% 16216 09.9% 259502 163497 63.0 07.7
Jan21 10851 06.8% 7129 4.5% 17980 11.3% 6284 3.9% 24264 15.2% 260851 159234 61.0 12.0
Jan18 07189 04.5% 5364 3.3% 12553 07.
NOTIFY: Y | REPLY | REPLY WITH QUOTE | PERMALINK | TOP | HOME
Updating with today's Jobs Report to this Table of Data, which seems to best show the components of U6:
I will refer to this set of data as Table JSF-URF-2
Note: this year the Marginally Attached data is in Table A-16 of the report.
Quote:
I will post some actual numbers and let the comparisons and discussion follow. The documented shenanigans of Obamabots deliberately refusing to Report jobless data in the months before the 2012 Election are a different matter, I will just use the Fake Data they produced and pretend it was real.
The BLS uses both Seasonally Adjusted figures and Unadjusted figures, and interchanges them without clearly identifying so. For example, the current Rate of 4.1% (for 4 months straight) is SeasAdj, and the real Rate is 4.5% for Jan 2018. I will use only the Unadjusted numbers, to help maintain clarity and transparency.
Some numbers may have a 0 placed as first digit, to maintain column form in this format.
The 1st column of numbers is the unemployed. The 2nd column is the Rate.
The 3rd column is what is called Marginally Attached to the Labor Force, which is included in the Want A Job Now category but NOT included in the Labor Force category and therefore excluded from the reported Unemployment category. The 5th column is the sum of Unemployed plus Marginally Attached - which more accurately represents the Actual Unemployed. The 6th column is the Rate for column 5 figure.
The 7th column is the Involuntary Part-Time workers, who are Not Employed Full Time due to poor Economy, and want, are able to work FT. The 8th column is the Rate for column 7. The 9th column is the sum of the 5th column plus 7th column. 10th column is the Rate for column 9 figure. The Rates in columns 2, 4, 6, 8, 10 have the denominator of Labor Force.
The 11th column is the Civilian Population. 12th column is Labor Force, 13th column is Participation Rate. 14th column is the published U-6 figure.
Figures in thousands.
MoYr Unemp Pct MrgAt Pct SbTtl Pct InvPT Pct Total Pcnt CivPop LbrFrc Prtc% U6%
Ja93 09911 07.9 2120 1.6 11612 09.0 6181 4.9 16575 12.8 192644 126034 65.4
Ja94 09492 07.3 2120 1.6 11612 09.0 4963 3.8 16575 12.8 195953 129393 66.0
Ja95 08101 06.2 1783 1.4 09884 07.6 4620 3.5 14504 11.1 197753 130698 66.1
Ja96 08270 06.3 1737 1.3 10007 07.6 4103 3.1 14110 10.7 199634 131396 65.8 10.8
Ja97 07933 05.9 1615 1.2 09548 07.1 4338 3.2 13886 10.3 202285 134317 66.4 10.4
Ja98 07069 05.2 1479 1.1 08548 06.3 4090 3.0 12638 09.3 204238 135951 66.6 09.3
Ja99 06604 04.8 1358 1.0 07962 05.8 3645 2.6 11607 08.4 206719 137943 66.7 08.5
Ja00 06316 04.5 1197 0.9 07513 05.4 3355 2.4 10868 07.8 208782 139621 66.9 07.8
Ja01 06647 04.7 1290 0.9 07937 05.6 3559 2.5 11496 08.2 210889 141049 66.9 08.1
Ja02 08935 06.3 1509 1.1 10444 07.4 4249 3.0 14693 10.4 213089 141074 66.2 10.5
Ja02 09051 06.3 1532 1.1 10583 07.4 4453 3.1 15036 10.5 216506 143228 66.2 10.5
Ja03 09395 06.5 1598 1.1 10993 07.6 5003 3.4 15996 11.0 219897 145301 66.1 11.0
Ja04 09144 06.3 1670 1.1 10814 07.4 5152 3.5 15966 10.9 222161 146068 65.7 10.9
Ja05 08444 05.7 1804 1.2 10248 07.0 4793 3.3 15041 10.2 224837 147125 65.4 10.2
Ja06 07608 05.1 1644 1.1 09252 06.2 4513 3.0 13765 09.2 227553 149090 65.5 09.2
Ja07 07649 05.0 1577 1.0 09226 06.1 4620 3.0 13846 09.1 230650 151924 65.9 09.1
Ja08 08221 05.4 1729 1.1 09950 06.5 5235 3.4 15185 09.9 232616 152828 65.7 09.9
Ja09 13009 08.5 2130 1.4 15139 09.9 8675 5.6 23814 15.5 234739 153445 65.4 15.4
Ja10 16147 10.6 2539 1.6 18686 12.2 9161 6.0 27847 18.2 236832 152957 64.6 18.0
Ja11 14937 09.8 2800 1.8 17737 11.6 9027 5.9 26764 17.5 238704 152536 63.9 17.3
Ja12 13541 08.8 2809 1.9 16350 10.7 8747 5.7 25097 16.4 242269 153485 63.4 16.2
Ja13 13181 08.5 2443 1.6 15624 10.1 8506 5.5 24130 15.6 244663 154794 63.3 15.4
Ja14 10855 07.0 2592 1.7 13447 08.7 7617 4.9 21
NOTIFY: Y | REPLY | REPLY WITH QUOTE | PERMALINK | TOP | HOME
This Table of Data, which includes Not Fully Employed Rate.
I will refer to this set of data as Table JSF-URF-3
I will post some actual numbers and let the comparisons and discussion follow.
The BLS uses both Seasonally Adjusted figures and Unadjusted figures, and interchanges them without clearly identifying so. I will use only the Unadjusted numbers, to help maintain clarity and transparency.
Some numbers may have a 0 placed as first digit, to maintain column form in this format.
The 1st column of numbers is the Unemployed.
The 2nd column is what is called Marginally Attached to the Labor Force, which is included in the Want A Job Now category but NOT included in the Labor Force category and therefore excluded from the reported Unemployment category.
The 3rd column is the Involuntary Part-Time workers, who are Not Employed Full Time due to poor Economy, and want, are able to work FT. The 4th column of numbers is the sum of the 1st, 2nd, and 3rd columns. 5th column is the Rate for column 4 figure, divided by Labor Force.
The 6th column of numbers is the Subtotal of columns 1 and 3, Unemployed plus Involuntary Part-Time.
The 7th column is Labor Force minus column 6. This is also Employed minus column 3 Involuntary Part-Time. This is not a figure identified by BLS, so I will call it Actually Fully Employed. This is Employed Full-time plus Voluntary Part-Time.
Not listed, but Civilian noninstitutional Population minus Actually Fully Employed is also a figure avoided by BLS, and I will call it Not Fully Employed, which is Unemployed plus Involuntary Part-Time plus Marginally Attached plus Not In Labor Force. The 8th column is Not Fully Employed Rate, which is divided by Civilian noninstitutional Population.
The 9th column is the Civilian Population. 10th column is Labor Force, 11th column is Participation Rate. 12th column is the published U-6 figure.
Figures in thousands.
Mo/Yr Unem MrgAt InvPT Totl Prct SbTtl AcEmpl NotEm CivPop LbrForc Prtc% U6%
Jan94 09492 2120 4963 16575 12.8 14455 114938 41.3% 195953 129393 66.0
Jan95 08101 1783 4620 14504 11.1 12721 117923 40.4% 197753 130698 66.1
Jan96 08270 1737 4103 14110 10.7 12373 119023 40.4% 199634 131396 65.8 10.8
Jan97 07933 1615 4338 13886 10.3 12271 122046 39.7% 202285 134317 66.4 10.4
Jan98 07069 1479 4090 12638 09.3 11159 124798 38.9% 204238 135951 66.6 09.3
Jan99 06604 1358 3645 11607 08.4 10249 127694 38.2% 206719 137943 66.7 08.5
Jan00 06316 1197 3355 10868 07.8 09671 129950 37.8% 208782 139621 66.9 07.8
Jan01 06647 1290 3559 11496 08.2 10206 130843 38.0% 210889 141049 66.9 08.1
Jan02 08935 1509 4249 14693 10.4 13184 127890 40.0% 213089 141074 66.2 10.5
Jan02 09051 1532 4453 15036 10.5 13504 129724 40.1% 216506 143228 66.2 10.5
Jan03 09395 1598 5003 15996 11.0 14398 130903 40.5% 219897 145301 66.1 11.0
Jan04 09144 1670 5152 15966 10.9 14296 131772 40.7% 222161 146068 65.7 10.9
Jan05 08444 1804 4793 15041 10.2 13237 133888 40.5% 224837 147125 65.4 10.2
Jan06 07608 1644 4513 13765 09.2 12122 136978 39.8% 227553 149090 65.5 09.2
Jan07 07649 1577 4620 13846 09.1 12269 139655 39.5% 230650 151924 65.9 09.1
Jan08 08221 1729 5235 15185 09.9 13456 139372 40.1% 232616 152828 65.7 09.9
Jan09 13009 2130 8675 23814 15.5 21684 131761 43.9% 234739 153445 65.4 15.4
Jan10 16147 2539 9161 27847 18.2 25308 127649 46.1% 236832 152957 64.6 18.0
Jan11 14937 2800 9027 26764 17.5 23964 128572 46.1% 238704 152536 63.9 17.3
Jan12 13541 2809 8747 25097 16.4 22288 131197 45.8% 242269 153485 63.4 16.2
Jan13 13181 2443 8506 24130 15.6 21687 133107 45.6% 244663 154794 63.3 15.4
Jan14 10855 2592 7617 21064 13.6 18472 135909 45.0% 246915 154381 62.5 13.5
Jan15 09498 2234 7125 18
NOTIFY: Y | REPLY | REPLY WITH QUOTE | PERMALINK | TOP | HOME
The shadowstats site is lean on actual data, requiring a subscription to access what it claims as database.
However, I will make attempt to add in some of the data it presents. This does make assumption that their methodology and counting methods are valid, which I cannot find clear information about.
There also may be comingling of Seasonally Adjusted figures from shadowstats without clarity, but this will be the only series of Tables I post which veer from Not Seasonally Adjusted figures.
The charts they present do show that Unemployment under Trump is better than any time under Obamanomics, so it may be a worthwhile endeavor to investigate.
I will refer to this set of data as Table JSF-URF-5
I will post some actual numbers and let the comparisons and discussion follow. The documented shenanigans of Obamabots deliberately refusing to Report jobless data in the months before the 2012 Election are a different matter, I will just use the Fake Data they produced and pretend it was real.
The 1st column of numbers is the unemployed. The 2nd column is the Rate.
The 3rd column is the sum of the Unemployed plus Marginally Attached plus Involuntary Part-time. 4th column is the Rate for column 3 figure. The Rates in columns 2 and 4 have the denominator of Labor Force.
The 5th column is the Civilian Population. 6th column is Labor Force, 7th column is Participation Rate. 8th column is the published U-6 figure.
The 9th column is the Real Unemployment figure, as presented by shadowstats. The 10th column is the underreported, the difference between the U-6 figure from BLS and the Real figure from shadowstats.
Figures in thousands.
MoYr Unem Pcnt Total Prcnt CivPop LbrForc Prtc% U6% Real Separation
Ja93 09911 07.9 16575 12.8 192644 126034 65.4
Ja94 09492 07.3 16575 12.8 195953 129393 66.0 12% 15.3% 2.3%
Ja95 08101 06.2 14504 11.1 197753 130698 66.1 10% 13.5% 3.5%
Ja96 08270 06.3 14110 10.7 199634 131396 65.8 10.8% 13.5% 2.7%
Ja97 07933 05.9 13886 10.3 202285 134317 66.4 10.4% 13% 2.6%
Ja98 07069 05.2 12638 09.3 204238 135951 66.6 09.3% 12% 2.7%
Ja99 06604 04.8 11607 08.4 206719 137943 66.7 08.5% 11.5% 3.0%
Ja00 06316 04.5 10868 07.8 208782 139621 66.9 07.8% 11% 3.2%
Ja01 06647 04.7 11496 08.2 210889 141049 66.9 08.1% 10.5% 2.4%
Ja02 08935 06.3 14693 10.4 213089 141074 66.2 10.5% 13% 2.5%
Ja02 09051 06.3 15036 10.5 216506 143228 66.2 10.5% 13% 2.5%
Ja03 09395 06.5 15996 11.0 219897 145301 66.1 11.0% 13% 2.0%
Ja04 09144 06.3 15966 10.9 222161 146068 65.7 10.9% 14% 3.1%
Ja05 08444 05.7 15041 10.2 224837 147125 65.4 10.2% 13% 2.8%
Ja06 07608 05.1 13765 09.2 227553 149090 65.5 09.2% 12% 2.8%
Ja07 07649 05.0 13846 09.1 230650 151924 65.9 09.1% 12% 2.9%
Ja08 08221 05.4 15185 09.9 232616 152828 65.7 09.9% 13% 3.1%
Ja09 13009 08.5 23814 15.5 234739 153445 65.4 15.4% 20% 4.6%
Ja10 16147 10.6 27847 18.2 236832 152957 64.6 18.0% 22% 4.0%
Ja11 14937 09.8 26764 17.5 238704 152536 63.9 17.3% 22.5% 5.2%
Ja12 13541 08.8 25097 16.4 242269 153485 63.4 16.2% 22.5% 6.3%
Ja13 13181 08.5 24130 15.6 244663 154794 63.3 15.4% 23% 7.6%
Ja14 10855 07.0 21064 13.6 246915 154381 62.5 13.5% 23.5% 10%
Ja15 09498 06.1 18857 12.1 249723 156050 62.5 12.0% 23.5% 11.5%
Ja16 08309 05.3 16632 10.6 252397 157347 62.3 10.5% 23% 12.5%
Ja17 08149 05.1 16028 10.1 254082 158676 62.5 10.1% 23% 12.9%
Ja18 07189 04.5 14222 08.9 256780 160037 62.3 08.9% 22% 13.1%
Ja19 07140 04.4 14297 08.8 258239 162104 62.8 08.8% 21.8% 13.0%
Ja20 06504 04.0 12573 07.7 259502 163497 63.0 07.7% 21.0% 13.3%
Ja21 10851 06.8 19188 12.1 260851 159234 61.0 12.0% 25.7% 13.7%
Ja18 07189 04.5 14222 08.9 256780 160037 62.3 08.9% 22% 13.1%
Fb18 07091 04.4 13934 08.6 25693
NOTIFY: Y | REPLY | REPLY WITH QUOTE | PERMALINK | TOP | HOME
This Table of Data, which breaks down the numerical changes in the key figures.
I will refer to this set of data as Table JSF-URF-6
I will post some actual numbers and let the comparisons and discussion follow.
The BLS uses both Seasonally Adjusted figures and Unadjusted figures, and interchanges them without clearly identifying so. I will use only the Unadjusted numbers, to help maintain clarity and transparency.
Some numbers may have a 0 placed as first digit, to maintain column form in this format.
The 1st column is Labor Force minus both Unemployed and Involuntary Part-Time. This is also Employed minus Involuntary Part-Time. This is not a figure identified by BLS, so I will call it Actually Fully Employed. This is Employed Full-time plus Voluntary Part-Time.
Not listed, but Civilian noninstitutional Population minus Actually Fully Employed is also a figure avoided by BLS, and I will call it Not Fully Employed, which is Unemployed plus Involuntary Part-Time plus Marginally Attached plus Not In Labor Force. The 2nd column is Not Fully Employed Rate, which is divided by Civilian noninstitutional Population.
The 3rd column is the Civilian Population. 4th column is Labor Force, 5th column is Participation Rate.
After the separation bar, the 7th column is the Increase in Civilian Population from the previous entry. For the entries by year, this is the 12 month Increase. For the entries broken down by month, this is the 1 month Increase.
The 8th column is the Increase in Labor Force from the previous entry.
The 9th column is the Increase in Actually Fully Employed count, from the previous entry.
In the monthly breakdown for 2018, after the second separation bar, the 10th column is the Civilian Population Increase from the entry 12 months prior.
The 11th column is the Labor Force Increase from the entry 12 months prior.
The 12th column is the Actually Fully Employed Increase from the entry 12 months prior.
The 13th column is the amount that the 12th column exceeds the 10th column, or the amount of Unemployed that is being chipped away, despite manipulation of other figures.
Figures in thousands.
Mo/Yr AcEmpl NtEm CiviPop LbrFrc Prtc% | CPIn LFIn AEInc
Jan94 114938 41.3% 195953 129393 66.0% |
Jan95 117923 40.4% 197753 130698 66.1% | 1800 1305 02985/+1185
Jan96 119023 40.4% 199634 131396 65.8% | 1881 0698 01100/-0781
Jan97 122046 39.7% 202285 134317 66.4% | 2651 2921 03023/+0372
Jan98 124798 38.9% 204238 135951 66.6% | 1953 1634 02752/+0799
Jan99 127694 38.2% 206719 137943 66.7% | 2481 1992 02896/+0415
Jan00 129950 37.8% 208782 139621 66.9% | 2063 1678 02256/+0193
Jan01 130843 38.0% 210889 141049 66.9% | 2107 1428 00893/-1214
Jan02 127890 40.0% 213089 141074 66.2% | 2200 0025 -2953/-5153
Jan02 129724 40.1% 216506 143228 66.2% | 5617 2179 -1119/-6736
Jan03 130903 40.5% 219897 145301 66.1% | 3391 2073 01179/-2212
Jan04 131772 40.7% 222161 146068 65.7% | 2264 0767 00869/-1395
Jan05 133888 40.5% 224837 147125 65.4% | 2676 1057 02116/-0560
Jan06 136978 39.8% 227553 149090 65.5% | 2716 1965 03090/+0374
Jan07 139655 39.5% 230650 151924 65.9% | 3097 2834 02677/-0420
Jan08 139372 40.1% 232616 152828 65.7% | 1966 0904 -0283/-2249
Jan09 131761 43.9% 234739 153445 65.4% | 2123 0617 -7611/-9734
Jan10 127649 46.1% 236832 152957 64.6% | 2093 -488 -4112/-6205
Jan11 128572 46.1% 238704 152536 63.9% | 1872 -421 00923/-0949
Jan12 131197 45.8% 242269 153485 63.4% | 3565 0949 02625/-0940
Jan13 133107 45.6% 244663 154794 63.3% | 2394 1309 01910/-0484
Jan14 135909 45.0% 246915 154381 62.5% | 2252 -413 02802/+0550
Jan15 139427 44.2% 249723 156050 62.5% | 2808 1669 03518/+0710
Jan16 14280
NOTIFY: Y | REPLY | REPLY WITH QUOTE | PERMALINK | TOP | HOME
Record amount of jobs quit in November, and only less than 200k jobs filled in December.
You'd better back off on the vaccine mandates, Joe*.
--------------------------------------------------
Vaccinated People: "You need to get muh vaccination shots that don't work because I got muh vaccination shots that don't work and I'm afraid of people that didn't get muh vaccination shots that don't work because muh vaccination shots that don't work don't work."
NOTIFY: Y | REPLY | REPLY WITH QUOTE | PERMALINK | TOP | HOME
https://www.bls.gov/news.release/laus.nr0.htm
Tables A and B.
Show that US average Unemployment Rate of 4.2%.
All of the states higher than that are Democrat-run Libtard sh!tholes, except TX and AK.
TX suffers from Libtards recruiting and importing millions of Unemployed Illegal Aliens. AK has an Energy-intensive economy, and Libtards have shutdown and strangled all energy production.
NOTIFY: Y | REPLY | REPLY WITH QUOTE | PERMALINK | TOP | HOME
Quote:Sorry, I didn't finish filling out the data until after you posted that.
Originally posted by 6IXSTRINGJACK:
Record amount of jobs quit in November, and only less than 200k jobs filled in December.
You'd better back off on the vaccine mandates, Joe*.
The bloat shown by Shadow Stats is the worst in history.
They continue with 3.7 million more Unemployed than Trump had 2 years ago. While the Civ Pop gained 2 million. Like they are not even trying, it seems.
Population gains continue to trend lower and lower.
As an aside, my phone carrier forced me to change phones. The 3 free phone options were too big, so I paid $10 for the smallest they had. Now it doesn't work for a lot of things I want/need. But I can log in here now, but some postings are limited.
One thing it seems unable to do is auto-size the font, like every other phone I've had. So to get the tables to line up again I had to manually set the display font to small, which is smaller than needed.
NOTIFY: Y | REPLY | REPLY WITH QUOTE | PERMALINK | TOP | HOME
Diversity hire Jen sez that BLS does not count employed people as employed people, just because they did not go to work on the day of the survey as a result of Libtard Lockdowns and Vaxx Mandates.
As forewarning of the horrible Employment Report this week.
Obviously, BLS does not agree with such nonsense.
NOTIFY: Y | REPLY | REPLY WITH QUOTE | PERMALINK | TOP | HOME
Updating with Jobs Report data from today:
I will refer to this set of data as Table JSF-URF-1
Jan 2002 is listed twice. First with original report data from February 2002. Second with revised data from new Census data, published in February 2003.
Quote:
Originally posted by JEWELSTAITEFAN:
BLS currently defines the Want A Job category as not being part of the Labor Force.
So I will post some actual numbers and let the comparisons and discussion follow. The documented shenanigans of Obamabots deliberately refusing to Report jobless data in the months before the 2012 Election are a different matter, I will just use the Fake Data they produced and pretend it was real.
I will use only the Unadjusted numbers, to help maintain clarity and transparency.
Mo/Yr Unemp Pcnt WAJb Pcnt SubTtl Pcnt InvPT Pcnt Total Prcnt CivPop LbrFrc Prtc% U-6
Jan98 07069 05.2% 5026 3.7% 12095 08.9% 4090 3.0% 16185 11.9% 204238 135951 66.6 09.3
Jan99 06604 04.8% 4800 3.5% 11404 08.3% 3645 2.6% 15049 10.9% 206719 137943 66.7 08.5
Jan00 06316 04.5% 4354 3.1% 10670 07.6% 3355 2.4% 14025 10.0% 208782 139621 66.9 07.8
Jan01 06647 04.7% 4474 3.2% 11121 07.9% 3559 2.5% 14680 10.4% 210889 141049 66.9 08.1
Jan02 08935 06.3% 4872 3.5% 13807 09.8% 4249 3.0% 18056 12.8% 213089 141074 66.2 10.5
Jan02 09051 06.3% 4938 3.4% 13989 09.8% 4453 3.1% 18442 12.9% 216506 143228 66.2 10.5
Jan03 09395 06.5% 4779 3.3% 14174 09.8% 5003 3.4% 19177 13.2% 219897 145301 66.1 11.0
Jan04 09144 06.3% 4913 3.4% 14057 09.6% 5152 3.5% 19209 13.2% 222161 146068 65.7 10.9
Jan05 08444 05.7% 5136 3.5% 13580 09.2% 4793 3.3% 18373 12.5% 224837 147125 65.4 10.2
Jan06 07608 05.1% 5095 3.4% 12703 08.5% 4513 3.0% 17216 11.5% 227553 149090 65.5 09.2
Jan07 07649 05.0% 4633 3.0% 12282 08.1% 4620 3.0% 16902 11.1% 230650 151924 65.9 09.1
Jan08 08221 05.4% 4977 3.2% 13198 08.6% 5235 3.5% 18433 12.1% 232616 152828 65.7 09.9
Jan09 13009 08.5% 5866 3.8% 18875 12.3% 8675 5.7% 27550 18.0% 234739 153445 65.4 15.4
Jan10 16147 10.6% 6108 4.0% 22255 14.6% 9161 5.9% 31416 20.5% 236832 152957 64.6 18.0
Jan11 14937 09.8% 6643 4.3% 21580 14.1% 9027 6.0% 30607 20.1% 238704 152536 63.9 17.3
Jan12 13541 08.8% 6495 4.3% 20036 13.1% 8747 5.7% 28783 18.8% 242269 153485 63.4 16.2
Jan13 13181 08.5% 6781 4.4% 19962 12.9% 8506 5.5% 28468 18.4% 244663 154794 63.3 15.4
Jan14 10855 07.0% 6508 4.2% 17363 11.2% 7617 5.0% 24980 16.2% 246915 154381 62.5 13.5
Jan15 09498 06.1% 6467 4.1% 15965 10.2% 7125 4.6% 23090 14.8% 249723 156050 62.5 12.0
Jan16 08309 05.3% 6166 3.9% 14475 09.2% 6234 4.0% 20709 13.2% 252397 157347 62.3 10.5
Jan17 08149 05.1% 5934 3.8% 14083 08.9% 6127 3.8% 20210 12.7% 254082 158676 62.5 10.1
Jan18 07189 04.5% 5364 3.3% 12553 07.8% 5380 3.4% 17933 11.2% 256780 160037 62.3 08.9
Jan19 07140 04.4% 5435 3.4% 12575 07.8% 5543 3.4% 18118 11.2% 258239 162104 62.8 08.8
Jan20 06504 04.0% 5107 3.1% 11611 07.1% 4605 2.8% 16216 09.9% 259502 163497 63.0 07.7
Jan21 10851 06.8% 7129 4.5% 17980 11.3% 6284 3.9% 24264 15.2% 260851 159234 61.0 12.0
Jan22 07207 04.4% 5872 3.6% 13079 08.0
NOTIFY: Y | REPLY | REPLY WITH QUOTE | PERMALINK | TOP | HOME
Updating with today's Jobs Report to this Table of Data, which seems to best show the components of U6:
I will refer to this set of data as Table JSF-URF-2
Note: this year the Marginally Attached data is in Table A-16 of the report.
Quote:
I will post some actual numbers and let the comparisons and discussion follow. The documented shenanigans of Obamabots deliberately refusing to Report jobless data in the months before the 2012 Election are a different matter, I will just use the Fake Data they produced and pretend it was real.
The BLS uses both Seasonally Adjusted figures and Unadjusted figures, and interchanges them without clearly identifying so. For example, the current Rate of 4.1% (for 4 months straight) is SeasAdj, and the real Rate is 4.5% for Jan 2018. I will use only the Unadjusted numbers, to help maintain clarity and transparency.
Some numbers may have a 0 placed as first digit, to maintain column form in this format.
The 1st column of numbers is the unemployed. The 2nd column is the Rate.
The 3rd column is what is called Marginally Attached to the Labor Force, which is included in the Want A Job Now category but NOT included in the Labor Force category and therefore excluded from the reported Unemployment category. The 5th column is the sum of Unemployed plus Marginally Attached - which more accurately represents the Actual Unemployed. The 6th column is the Rate for column 5 figure.
The 7th column is the Involuntary Part-Time workers, who are Not Employed Full Time due to poor Economy, and want, are able to work FT. The 8th column is the Rate for column 7. The 9th column is the sum of the 5th column plus 7th column. 10th column is the Rate for column 9 figure. The Rates in columns 2, 4, 6, 8, 10 have the denominator of Labor Force.
The 11th column is the Civilian Population. 12th column is Labor Force, 13th column is Participation Rate. 14th column is the published U-6 figure.
Figures in thousands.
MoYr Unemp Pct MrgAt Pct SbTtl Pct InvPT Pct Total Pcnt CivPop LbrFrc Prtc% U6%
Ja93 09911 07.9 2120 1.6 11612 09.0 6181 4.9 16575 12.8 192644 126034 65.4
Ja94 09492 07.3 2120 1.6 11612 09.0 4963 3.8 16575 12.8 195953 129393 66.0
Ja95 08101 06.2 1783 1.4 09884 07.6 4620 3.5 14504 11.1 197753 130698 66.1
Ja96 08270 06.3 1737 1.3 10007 07.6 4103 3.1 14110 10.7 199634 131396 65.8 10.8
Ja97 07933 05.9 1615 1.2 09548 07.1 4338 3.2 13886 10.3 202285 134317 66.4 10.4
Ja98 07069 05.2 1479 1.1 08548 06.3 4090 3.0 12638 09.3 204238 135951 66.6 09.3
Ja99 06604 04.8 1358 1.0 07962 05.8 3645 2.6 11607 08.4 206719 137943 66.7 08.5
Ja00 06316 04.5 1197 0.9 07513 05.4 3355 2.4 10868 07.8 208782 139621 66.9 07.8
Ja01 06647 04.7 1290 0.9 07937 05.6 3559 2.5 11496 08.2 210889 141049 66.9 08.1
Ja02 08935 06.3 1509 1.1 10444 07.4 4249 3.0 14693 10.4 213089 141074 66.2 10.5
Ja02 09051 06.3 1532 1.1 10583 07.4 4453 3.1 15036 10.5 216506 143228 66.2 10.5
Ja03 09395 06.5 1598 1.1 10993 07.6 5003 3.4 15996 11.0 219897 145301 66.1 11.0
Ja04 09144 06.3 1670 1.1 10814 07.4 5152 3.5 15966 10.9 222161 146068 65.7 10.9
Ja05 08444 05.7 1804 1.2 10248 07.0 4793 3.3 15041 10.2 224837 147125 65.4 10.2
Ja06 07608 05.1 1644 1.1 09252 06.2 4513 3.0 13765 09.2 227553 149090 65.5 09.2
Ja07 07649 05.0 1577 1.0 09226 06.1 4620 3.0 13846 09.1 230650 151924 65.9 09.1
Ja08 08221 05.4 1729 1.1 09950 06.5 5235 3.4 15185 09.9 232616 152828 65.7 09.9
Ja09 13009 08.5 2130 1.4 15139 09.9 8675 5.6 23814 15.5 234739 153445 65.4 15.4
Ja10 16147 10.6 2539 1.6 18686 12.2 9161 6.0 27847 18.2 236832 152957 64.6 18.0
Ja11 14937 09.8 2800 1.8 17737 11.6 9027 5.9 26764 17.5 238704 152536 63.9 17.3
Ja12 13541 08.8 2809 1.9 16350 10.7 8747 5.7 25097 16.4 242269 153485 63.4 16.2
Ja13 13181 08.5 2443 1.6 15624 10.1 8506 5.5 24130 15.6 244663 154794 63.3 15.4
Ja14 10855 07.0 2592 1.7 13447 08.7 7617 4.9
NOTIFY: Y | REPLY | REPLY WITH QUOTE | PERMALINK | TOP | HOME
This Table of Data, which includes Not Fully Employed Rate.
I will refer to this set of data as Table JSF-URF-3
I will post some actual numbers and let the comparisons and discussion follow.
The BLS uses both Seasonally Adjusted figures and Unadjusted figures, and interchanges them without clearly identifying so. I will use only the Unadjusted numbers, to help maintain clarity and transparency.
Some numbers may have a 0 placed as first digit, to maintain column form in this format.
The 1st column of numbers is the Unemployed.
The 2nd column is what is called Marginally Attached to the Labor Force, which is included in the Want A Job Now category but NOT included in the Labor Force category and therefore excluded from the reported Unemployment category.
The 3rd column is the Involuntary Part-Time workers, who are Not Employed Full Time due to poor Economy, and want, are able to work FT. The 4th column of numbers is the sum of the 1st, 2nd, and 3rd columns. 5th column is the Rate for column 4 figure, divided by Labor Force.
The 6th column of numbers is the Subtotal of columns 1 and 3, Unemployed plus Involuntary Part-Time.
The 7th column is Labor Force minus column 6. This is also Employed minus column 3 Involuntary Part-Time. This is not a figure identified by BLS, so I will call it Actually Fully Employed. This is Employed Full-time plus Voluntary Part-Time.
Not listed, but Civilian noninstitutional Population minus Actually Fully Employed is also a figure avoided by BLS, and I will call it Not Fully Employed, which is Unemployed plus Involuntary Part-Time plus Marginally Attached plus Not In Labor Force. The 8th column is Not Fully Employed Rate, which is divided by Civilian noninstitutional Population.
The 9th column is the Civilian Population. 10th column is Labor Force, 11th column is Participation Rate. 12th column is the published U-6 figure.
Figures in thousands.
Mo/Yr Unem MrgAt InvPT Totl Prct SbTtl AcEmpl NotEm CivPop LbrForc Prtc% U6%
Jan94 09492 2120 4963 16575 12.8 14455 114938 41.3% 195953 129393 66.0
Jan95 08101 1783 4620 14504 11.1 12721 117923 40.4% 197753 130698 66.1
Jan96 08270 1737 4103 14110 10.7 12373 119023 40.4% 199634 131396 65.8 10.8
Jan97 07933 1615 4338 13886 10.3 12271 122046 39.7% 202285 134317 66.4 10.4
Jan98 07069 1479 4090 12638 09.3 11159 124798 38.9% 204238 135951 66.6 09.3
Jan99 06604 1358 3645 11607 08.4 10249 127694 38.2% 206719 137943 66.7 08.5
Jan00 06316 1197 3355 10868 07.8 09671 129950 37.8% 208782 139621 66.9 07.8
Jan01 06647 1290 3559 11496 08.2 10206 130843 38.0% 210889 141049 66.9 08.1
Jan02 08935 1509 4249 14693 10.4 13184 127890 40.0% 213089 141074 66.2 10.5
Jan02 09051 1532 4453 15036 10.5 13504 129724 40.1% 216506 143228 66.2 10.5
Jan03 09395 1598 5003 15996 11.0 14398 130903 40.5% 219897 145301 66.1 11.0
Jan04 09144 1670 5152 15966 10.9 14296 131772 40.7% 222161 146068 65.7 10.9
Jan05 08444 1804 4793 15041 10.2 13237 133888 40.5% 224837 147125 65.4 10.2
Jan06 07608 1644 4513 13765 09.2 12122 136978 39.8% 227553 149090 65.5 09.2
Jan07 07649 1577 4620 13846 09.1 12269 139655 39.5% 230650 151924 65.9 09.1
Jan08 08221 1729 5235 15185 09.9 13456 139372 40.1% 232616 152828 65.7 09.9
Jan09 13009 2130 8675 23814 15.5 21684 131761 43.9% 234739 153445 65.4 15.4
Jan10 16147 2539 9161 27847 18.2 25308 127649 46.1% 236832 152957 64.6 18.0
Jan11 14937 2800 9027 26764 17.5 23964 128572 46.1% 238704 152536 63.9 17.3
Jan12 13541 2809 8747 25097 16.4 22288 131197 45.8% 242269 153485 63.4 16.2
Jan13 13181 2443 8506 24130 15.6 21687 133107 45.6% 244663 154794 63.3 15.4
Jan14 10855 2592 7617 21064 13.6 18472 135909 45.0% 246915 154381 62.5 13.5
Jan15 09498 2234 7125 18
NOTIFY: Y | REPLY | REPLY WITH QUOTE | PERMALINK | TOP | HOME
The shadowstats site is lean on actual data, requiring a subscription to access what it claims as database.
However, I will make attempt to add in some of the data it presents. This does make assumption that their methodology and counting methods are valid, which I cannot find clear information about.
There also may be comingling of Seasonally Adjusted figures from shadowstats without clarity, but this will be the only series of Tables I post which veer from Not Seasonally Adjusted figures.
The charts they present do show that Unemployment under Trump is better than any time under Obamanomics, so it may be a worthwhile endeavor to investigate.
I will refer to this set of data as Table JSF-URF-5
I will post some actual numbers and let the comparisons and discussion follow. The documented shenanigans of Obamabots deliberately refusing to Report jobless data in the months before the 2012 Election are a different matter, I will just use the Fake Data they produced and pretend it was real.
The 1st column of numbers is the unemployed. The 2nd column is the Rate.
The 3rd column is the sum of the Unemployed plus Marginally Attached plus Involuntary Part-time. 4th column is the Rate for column 3 figure. The Rates in columns 2 and 4 have the denominator of Labor Force.
The 5th column is the Civilian Population. 6th column is Labor Force, 7th column is Participation Rate. 8th column is the published U-6 figure.
The 9th column is the Real Unemployment figure, as presented by shadowstats. The 10th column is the underreported, the difference between the U-6 figure from BLS and the Real figure from shadowstats.
Figures in thousands.
MoYr Unem Pcnt Total Prcnt CivPop LbrForc Prtc% U6% Real Separation
Ja93 09911 07.9 16575 12.8 192644 126034 65.4
Ja94 09492 07.3 16575 12.8 195953 129393 66.0 12% 15.3% 2.3%
Ja95 08101 06.2 14504 11.1 197753 130698 66.1 10% 13.5% 3.5%
Ja96 08270 06.3 14110 10.7 199634 131396 65.8 10.8% 13.5% 2.7%
Ja97 07933 05.9 13886 10.3 202285 134317 66.4 10.4% 13% 2.6%
Ja98 07069 05.2 12638 09.3 204238 135951 66.6 09.3% 12% 2.7%
Ja99 06604 04.8 11607 08.4 206719 137943 66.7 08.5% 11.5% 3.0%
Ja00 06316 04.5 10868 07.8 208782 139621 66.9 07.8% 11% 3.2%
Ja01 06647 04.7 11496 08.2 210889 141049 66.9 08.1% 10.5% 2.4%
Ja02 08935 06.3 14693 10.4 213089 141074 66.2 10.5% 13% 2.5%
Ja02 09051 06.3 15036 10.5 216506 143228 66.2 10.5% 13% 2.5%
Ja03 09395 06.5 15996 11.0 219897 145301 66.1 11.0% 13% 2.0%
Ja04 09144 06.3 15966 10.9 222161 146068 65.7 10.9% 14% 3.1%
Ja05 08444 05.7 15041 10.2 224837 147125 65.4 10.2% 13% 2.8%
Ja06 07608 05.1 13765 09.2 227553 149090 65.5 09.2% 12% 2.8%
Ja07 07649 05.0 13846 09.1 230650 151924 65.9 09.1% 12% 2.9%
Ja08 08221 05.4 15185 09.9 232616 152828 65.7 09.9% 13% 3.1%
Ja09 13009 08.5 23814 15.5 234739 153445 65.4 15.4% 20% 4.6%
Ja10 16147 10.6 27847 18.2 236832 152957 64.6 18.0% 22% 4.0%
Ja11 14937 09.8 26764 17.5 238704 152536 63.9 17.3% 22.5% 5.2%
Ja12 13541 08.8 25097 16.4 242269 153485 63.4 16.2% 22.5% 6.3%
Ja13 13181 08.5 24130 15.6 244663 154794 63.3 15.4% 23% 7.6%
Ja14 10855 07.0 21064 13.6 246915 154381 62.5 13.5% 23.5% 10%
Ja15 09498 06.1 18857 12.1 249723 156050 62.5 12.0% 23.5% 11.5%
Ja16 08309 05.3 16632 10.6 252397 157347 62.3 10.5% 23% 12.5%
Ja17 08149 05.1 16028 10.1 254082 158676 62.5 10.1% 23% 12.9%
Ja18 07189 04.5 14222 08.9 256780 160037 62.3 08.9% 22% 13.1%
Ja19 07140 04.4 14297 08.8 258239 162104 62.8 08.8% 21.8% 13.0%
Ja20 06504 04.0 12573 07.7 259502 163497 63.0 07.7% 21.0% 13.3%
Ja21 10851 06.8 19188 12.1 260851 159234 61.0 12.0% 25.7% 13.7%
Ja22 07207 04.4 12924 07.9 263202 162825 61.9 07.9% 24.5% 16.6%
Ja18 07189 04.5 14222 08.9 25
NOTIFY: Y | REPLY | REPLY WITH QUOTE | PERMALINK | TOP | HOME
This Table of Data, which breaks down the numerical changes in the key figures.
I will refer to this set of data as Table JSF-URF-6
I will post some actual numbers and let the comparisons and discussion follow.
The BLS uses both Seasonally Adjusted figures and Unadjusted figures, and interchanges them without clearly identifying so. I will use only the Unadjusted numbers, to help maintain clarity and transparency.
Some numbers may have a 0 placed as first digit, to maintain column form in this format.
The 1st column is Labor Force minus both Unemployed and Involuntary Part-Time. This is also Employed minus Involuntary Part-Time. This is not a figure identified by BLS, so I will call it Actually Fully Employed. This is Employed Full-time plus Voluntary Part-Time.
Not listed, but Civilian noninstitutional Population minus Actually Fully Employed is also a figure avoided by BLS, and I will call it Not Fully Employed, which is Unemployed plus Involuntary Part-Time plus Marginally Attached plus Not In Labor Force. The 2nd column is Not Fully Employed Rate, which is divided by Civilian noninstitutional Population.
The 3rd column is the Civilian Population. 4th column is Labor Force, 5th column is Participation Rate.
After the separation bar, the 7th column is the Increase in Civilian Population from the previous entry. For the entries by year, this is the 12 month Increase. For the entries broken down by month, this is the 1 month Increase.
The 8th column is the Increase in Labor Force from the previous entry.
The 9th column is the Increase in Actually Fully Employed count, from the previous entry.
In the monthly breakdown for 2018, after the second separation bar, the 10th column is the Civilian Population Increase from the entry 12 months prior.
The 11th column is the Labor Force Increase from the entry 12 months prior.
The 12th column is the Actually Fully Employed Increase from the entry 12 months prior.
The 13th column is the amount that the 12th column exceeds the 10th column, or the amount of Unemployed that is being chipped away, despite manipulation of other figures.
Figures in thousands.
Mo/Yr AcEmpl NtEm CiviPop LbrFrc Prtc% | CPIn LFIn AEInc
Jan94 114938 41.3% 195953 129393 66.0% |
Jan95 117923 40.4% 197753 130698 66.1% | 1800 1305 02985/+1185
Jan96 119023 40.4% 199634 131396 65.8% | 1881 0698 01100/-0781
Jan97 122046 39.7% 202285 134317 66.4% | 2651 2921 03023/+0372
Jan98 124798 38.9% 204238 135951 66.6% | 1953 1634 02752/+0799
Jan99 127694 38.2% 206719 137943 66.7% | 2481 1992 02896/+0415
Jan00 129950 37.8% 208782 139621 66.9% | 2063 1678 02256/+0193
Jan01 130843 38.0% 210889 141049 66.9% | 2107 1428 00893/-1214
Jan02 127890 40.0% 213089 141074 66.2% | 2200 0025 -2953/-5153
Jan02 129724 40.1% 216506 143228 66.2% | 5617 2179 -1119/-6736
Jan03 130903 40.5% 219897 145301 66.1% | 3391 2073 01179/-2212
Jan04 131772 40.7% 222161 146068 65.7% | 2264 0767 00869/-1395
Jan05 133888 40.5% 224837 147125 65.4% | 2676 1057 02116/-0560
Jan06 136978 39.8% 227553 149090 65.5% | 2716 1965 03090/+0374
Jan07 139655 39.5% 230650 151924 65.9% | 3097 2834 02677/-0420
Jan08 139372 40.1% 232616 152828 65.7% | 1966 0904 -0283/-2249
Jan09 131761 43.9% 234739 153445 65.4% | 2123 0617 -7611/-9734
Jan10 127649 46.1% 236832 152957 64.6% | 2093 -488 -4112/-6205
Jan11 128572 46.1% 238704 152536 63.9% | 1872 -421 00923/-0949
Jan12 131197 45.8% 242269 153485 63.4% | 3565 0949 02625/-0940
Jan13 133107 45.6% 244663 154794 63.3% | 2394 1309 01910/-0484
Jan14 135909 45.0% 246915 154381 62.5% | 2252 -413 02802/+0550
Jan15 139427 44.2% 249723 156050 62.5% | 2808 1669 03518/+0710
Jan16 1428
NOTIFY: Y | REPLY | REPLY WITH QUOTE | PERMALINK | TOP | HOME
Updating with Jobs Report data from today:
I will refer to this set of data as Table JSF-URF-1
Jan 2002 is listed twice. First with original report data from February 2002. Second with revised data from new Census data, published in February 2003.
Quote:
Originally posted by JEWELSTAITEFAN:
BLS currently defines the Want A Job category as not being part of the Labor Force.
So I will post some actual numbers and let the comparisons and discussion follow. The documented shenanigans of Obamabots deliberately refusing to Report jobless data in the months before the 2012 Election are a different matter, I will just use the Fake Data they produced and pretend it was real.
I will use only the Unadjusted numbers, to help maintain clarity and transparency.
Mo/Yr Unemp Pcnt WAJb Pcnt SubTtl Pcnt InvPT Pcnt Total Prcnt CivPop LbrFrc Prtc% U-6
Jan98 07069 05.2% 5026 3.7% 12095 08.9% 4090 3.0% 16185 11.9% 204238 135951 66.6 09.3
Jan99 06604 04.8% 4800 3.5% 11404 08.3% 3645 2.6% 15049 10.9% 206719 137943 66.7 08.5
Jan00 06316 04.5% 4354 3.1% 10670 07.6% 3355 2.4% 14025 10.0% 208782 139621 66.9 07.8
Jan01 06647 04.7% 4474 3.2% 11121 07.9% 3559 2.5% 14680 10.4% 210889 141049 66.9 08.1
Jan02 08935 06.3% 4872 3.5% 13807 09.8% 4249 3.0% 18056 12.8% 213089 141074 66.2 10.5
Jan02 09051 06.3% 4938 3.4% 13989 09.8% 4453 3.1% 18442 12.9% 216506 143228 66.2 10.5
Jan03 09395 06.5% 4779 3.3% 14174 09.8% 5003 3.4% 19177 13.2% 219897 145301 66.1 11.0
Jan04 09144 06.3% 4913 3.4% 14057 09.6% 5152 3.5% 19209 13.2% 222161 146068 65.7 10.9
Jan05 08444 05.7% 5136 3.5% 13580 09.2% 4793 3.3% 18373 12.5% 224837 147125 65.4 10.2
Jan06 07608 05.1% 5095 3.4% 12703 08.5% 4513 3.0% 17216 11.5% 227553 149090 65.5 09.2
Jan07 07649 05.0% 4633 3.0% 12282 08.1% 4620 3.0% 16902 11.1% 230650 151924 65.9 09.1
Jan08 08221 05.4% 4977 3.2% 13198 08.6% 5235 3.5% 18433 12.1% 232616 152828 65.7 09.9
Jan09 13009 08.5% 5866 3.8% 18875 12.3% 8675 5.7% 27550 18.0% 234739 153445 65.4 15.4
Jan10 16147 10.6% 6108 4.0% 22255 14.6% 9161 5.9% 31416 20.5% 236832 152957 64.6 18.0
Jan11 14937 09.8% 6643 4.3% 21580 14.1% 9027 6.0% 30607 20.1% 238704 152536 63.9 17.3
Jan12 13541 08.8% 6495 4.3% 20036 13.1% 8747 5.7% 28783 18.8% 242269 153485 63.4 16.2
Jan13 13181 08.5% 6781 4.4% 19962 12.9% 8506 5.5% 28468 18.4% 244663 154794 63.3 15.4
Jan14 10855 07.0% 6508 4.2% 17363 11.2% 7617 5.0% 24980 16.2% 246915 154381 62.5 13.5
Jan15 09498 06.1% 6467 4.1% 15965 10.2% 7125 4.6% 23090 14.8% 249723 156050 62.5 12.0
Jan16 08309 05.3% 6166 3.9% 14475 09.2% 6234 4.0% 20709 13.2% 252397 157347 62.3 10.5
Jan17 08149 05.1% 5934 3.8% 14083 08.9% 6127 3.8% 20210 12.7% 254082 158676 62.5 10.1
Jan18 07189 04.5% 5364 3.3% 12553 07.8% 5380 3.4% 17933 11.2% 256780 160037 62.3 08.9
Jan19 07140 04.4% 5435 3.4% 12575 07.8% 5543 3.4% 18118 11.2% 258239 162104 62.8 08.8
Jan20 06504 04.0% 5107 3.1% 11611 07.1% 4605 2.8% 16216 09.9% 259502 163497 63.0 07.7
Jan21 10851 06.8% 7129 4.5% 17980 11.3% 6284 3.9% 24264 15.2% 260851 159234 61.0 12.0
Jan22 07207 04.4% 5872 3.6% 13079 08.0%
NOTIFY: Y | REPLY | REPLY WITH QUOTE | PERMALINK | TOP | HOME
Updating with today's Jobs Report to this Table of Data, which seems to best show the components of U6:
I will refer to this set of data as Table JSF-URF-2
Note: this year the Marginally Attached data is in Table A-16 of the report.
Quote:
I will post some actual numbers and let the comparisons and discussion follow. The documented shenanigans of Obamabots deliberately refusing to Report jobless data in the months before the 2012 Election are a different matter, I will just use the Fake Data they produced and pretend it was real.
The BLS uses both Seasonally Adjusted figures and Unadjusted figures, and interchanges them without clearly identifying so. For example, the current Rate of 4.1% (for 4 months straight) is SeasAdj, and the real Rate is 4.5% for Jan 2018. I will use only the Unadjusted numbers, to help maintain clarity and transparency.
Some numbers may have a 0 placed as first digit, to maintain column form in this format.
The 1st column of numbers is the unemployed. The 2nd column is the Rate.
The 3rd column is what is called Marginally Attached to the Labor Force, which is included in the Want A Job Now category but NOT included in the Labor Force category and therefore excluded from the reported Unemployment category. The 5th column is the sum of Unemployed plus Marginally Attached - which more accurately represents the Actual Unemployed. The 6th column is the Rate for column 5 figure.
The 7th column is the Involuntary Part-Time workers, who are Not Employed Full Time due to poor Economy, and want, are able to work FT. The 8th column is the Rate for column 7. The 9th column is the sum of the 5th column plus 7th column. 10th column is the Rate for column 9 figure. The Rates in columns 2, 4, 6, 8, 10 have the denominator of Labor Force.
The 11th column is the Civilian Population. 12th column is Labor Force, 13th column is Participation Rate. 14th column is the published U-6 figure.
Figures in thousands.
MoYr Unemp Pct MrgAt Pct SbTtl Pct InvPT Pct Total Pcnt CivPop LbrFrc Prtc% U6%
Ja93 09911 07.9 2120 1.6 11612 09.0 6181 4.9 16575 12.8 192644 126034 65.4
Ja94 09492 07.3 2120 1.6 11612 09.0 4963 3.8 16575 12.8 195953 129393 66.0
Ja95 08101 06.2 1783 1.4 09884 07.6 4620 3.5 14504 11.1 197753 130698 66.1
Ja96 08270 06.3 1737 1.3 10007 07.6 4103 3.1 14110 10.7 199634 131396 65.8 10.8
Ja97 07933 05.9 1615 1.2 09548 07.1 4338 3.2 13886 10.3 202285 134317 66.4 10.4
Ja98 07069 05.2 1479 1.1 08548 06.3 4090 3.0 12638 09.3 204238 135951 66.6 09.3
Ja99 06604 04.8 1358 1.0 07962 05.8 3645 2.6 11607 08.4 206719 137943 66.7 08.5
Ja00 06316 04.5 1197 0.9 07513 05.4 3355 2.4 10868 07.8 208782 139621 66.9 07.8
Ja01 06647 04.7 1290 0.9 07937 05.6 3559 2.5 11496 08.2 210889 141049 66.9 08.1
Ja02 08935 06.3 1509 1.1 10444 07.4 4249 3.0 14693 10.4 213089 141074 66.2 10.5
Ja02 09051 06.3 1532 1.1 10583 07.4 4453 3.1 15036 10.5 216506 143228 66.2 10.5
Ja03 09395 06.5 1598 1.1 10993 07.6 5003 3.4 15996 11.0 219897 145301 66.1 11.0
Ja04 09144 06.3 1670 1.1 10814 07.4 5152 3.5 15966 10.9 222161 146068 65.7 10.9
Ja05 08444 05.7 1804 1.2 10248 07.0 4793 3.3 15041 10.2 224837 147125 65.4 10.2
Ja06 07608 05.1 1644 1.1 09252 06.2 4513 3.0 13765 09.2 227553 149090 65.5 09.2
Ja07 07649 05.0 1577 1.0 09226 06.1 4620 3.0 13846 09.1 230650 151924 65.9 09.1
Ja08 08221 05.4 1729 1.1 09950 06.5 5235 3.4 15185 09.9 232616 152828 65.7 09.9
Ja09 13009 08.5 2130 1.4 15139 09.9 8675 5.6 23814 15.5 234739 153445 65.4 15.4
Ja10 16147 10.6 2539 1.6 18686 12.2 9161 6.0 27847 18.2 236832 152957 64.6 18.0
Ja11 14937 09.8 2800 1.8 17737 11.6 9027 5.9 26764 17.5 238704 152536 63.9 17.3
Ja12 13541 08.8 2809 1.9 16350 10.7 8747 5.7 25097 16.4 242269 153485 63.4 16.2
Ja13 13181 08.5 2443 1.6 15624 10.1 8506 5.5 24130 15.6 244663 154794 63.3 15.4
Ja14 10855 07.0 2592 1.7 13447 08.7 7617 4.9 2
NOTIFY: Y | REPLY | REPLY WITH QUOTE | PERMALINK | TOP | HOME
This Table of Data, which includes Not Fully Employed Rate.
I will refer to this set of data as Table JSF-URF-3
I will post some actual numbers and let the comparisons and discussion follow.
The BLS uses both Seasonally Adjusted figures and Unadjusted figures, and interchanges them without clearly identifying so. I will use only the Unadjusted numbers, to help maintain clarity and transparency.
Some numbers may have a 0 placed as first digit, to maintain column form in this format.
The 1st column of numbers is the Unemployed.
The 2nd column is what is called Marginally Attached to the Labor Force, which is included in the Want A Job Now category but NOT included in the Labor Force category and therefore excluded from the reported Unemployment category.
The 3rd column is the Involuntary Part-Time workers, who are Not Employed Full Time due to poor Economy, and want, are able to work FT. The 4th column of numbers is the sum of the 1st, 2nd, and 3rd columns. 5th column is the Rate for column 4 figure, divided by Labor Force.
The 6th column of numbers is the Subtotal of columns 1 and 3, Unemployed plus Involuntary Part-Time.
The 7th column is Labor Force minus column 6. This is also Employed minus column 3 Involuntary Part-Time. This is not a figure identified by BLS, so I will call it Actually Fully Employed. This is Employed Full-time plus Voluntary Part-Time.
Not listed, but Civilian noninstitutional Population minus Actually Fully Employed is also a figure avoided by BLS, and I will call it Not Fully Employed, which is Unemployed plus Involuntary Part-Time plus Marginally Attached plus Not In Labor Force. The 8th column is Not Fully Employed Rate, which is divided by Civilian noninstitutional Population.
The 9th column is the Civilian Population. 10th column is Labor Force, 11th column is Participation Rate. 12th column is the published U-6 figure.
Figures in thousands.
Mo/Yr Unem MrgAt InvPT Totl Prct SbTtl AcEmpl NotEm CivPop LbrForc Prtc% U6%
Jan94 09492 2120 4963 16575 12.8 14455 114938 41.3% 195953 129393 66.0
Jan95 08101 1783 4620 14504 11.1 12721 117923 40.4% 197753 130698 66.1
Jan96 08270 1737 4103 14110 10.7 12373 119023 40.4% 199634 131396 65.8 10.8
Jan97 07933 1615 4338 13886 10.3 12271 122046 39.7% 202285 134317 66.4 10.4
Jan98 07069 1479 4090 12638 09.3 11159 124798 38.9% 204238 135951 66.6 09.3
Jan99 06604 1358 3645 11607 08.4 10249 127694 38.2% 206719 137943 66.7 08.5
Jan00 06316 1197 3355 10868 07.8 09671 129950 37.8% 208782 139621 66.9 07.8
Jan01 06647 1290 3559 11496 08.2 10206 130843 38.0% 210889 141049 66.9 08.1
Jan02 08935 1509 4249 14693 10.4 13184 127890 40.0% 213089 141074 66.2 10.5
Jan02 09051 1532 4453 15036 10.5 13504 129724 40.1% 216506 143228 66.2 10.5
Jan03 09395 1598 5003 15996 11.0 14398 130903 40.5% 219897 145301 66.1 11.0
Jan04 09144 1670 5152 15966 10.9 14296 131772 40.7% 222161 146068 65.7 10.9
Jan05 08444 1804 4793 15041 10.2 13237 133888 40.5% 224837 147125 65.4 10.2
Jan06 07608 1644 4513 13765 09.2 12122 136978 39.8% 227553 149090 65.5 09.2
Jan07 07649 1577 4620 13846 09.1 12269 139655 39.5% 230650 151924 65.9 09.1
Jan08 08221 1729 5235 15185 09.9 13456 139372 40.1% 232616 152828 65.7 09.9
Jan09 13009 2130 8675 23814 15.5 21684 131761 43.9% 234739 153445 65.4 15.4
Jan10 16147 2539 9161 27847 18.2 25308 127649 46.1% 236832 152957 64.6 18.0
Jan11 14937 2800 9027 26764 17.5 23964 128572 46.1% 238704 152536 63.9 17.3
Jan12 13541 2809 8747 25097 16.4 22288 131197 45.8% 242269 153485 63.4 16.2
Jan13 13181 2443 8506 24130 15.6 21687 133107 45.6% 244663 154794 63.3 15.4
Jan14 10855 2592 7617 21064 13.6 18472 135909 45.0% 246915 154381 62.5 13.5
Jan15 09498 2234 7125 1885
NOTIFY: Y | REPLY | REPLY WITH QUOTE | PERMALINK | TOP | HOME
The shadowstats site is lean on actual data, requiring a subscription to access what it claims as database.
However, I will make attempt to add in some of the data it presents. This does make assumption that their methodology and counting methods are valid, which I cannot find clear information about.
There also may be comingling of Seasonally Adjusted figures from shadowstats without clarity, but this will be the only series of Tables I post which veer from Not Seasonally Adjusted figures.
The charts they present do show that Unemployment under Trump is better than any time under Obamanomics, so it may be a worthwhile endeavor to investigate.
I will refer to this set of data as Table JSF-URF-5
I will post some actual numbers and let the comparisons and discussion follow. The documented shenanigans of Obamabots deliberately refusing to Report jobless data in the months before the 2012 Election are a different matter, I will just use the Fake Data they produced and pretend it was real.
The 1st column of numbers is the unemployed. The 2nd column is the Rate.
The 3rd column is the sum of the Unemployed plus Marginally Attached plus Involuntary Part-time. 4th column is the Rate for column 3 figure. The Rates in columns 2 and 4 have the denominator of Labor Force.
The 5th column is the Civilian Population. 6th column is Labor Force, 7th column is Participation Rate. 8th column is the published U-6 figure.
The 9th column is the Real Unemployment figure, as presented by shadowstats. The 10th column is the underreported, the difference between the U-6 figure from BLS and the Real figure from shadowstats.
Figures in thousands.
MoYr Unem Pcnt Total Prcnt CivPop LbrForc Prtc% U6% Real Separation
Ja93 09911 07.9 16575 12.8 192644 126034 65.4
Ja94 09492 07.3 16575 12.8 195953 129393 66.0 12% 15.3% 2.3%
Ja95 08101 06.2 14504 11.1 197753 130698 66.1 10% 13.5% 3.5%
Ja96 08270 06.3 14110 10.7 199634 131396 65.8 10.8% 13.5% 2.7%
Ja97 07933 05.9 13886 10.3 202285 134317 66.4 10.4% 13% 2.6%
Ja98 07069 05.2 12638 09.3 204238 135951 66.6 09.3% 12% 2.7%
Ja99 06604 04.8 11607 08.4 206719 137943 66.7 08.5% 11.5% 3.0%
Ja00 06316 04.5 10868 07.8 208782 139621 66.9 07.8% 11% 3.2%
Ja01 06647 04.7 11496 08.2 210889 141049 66.9 08.1% 10.5% 2.4%
Ja02 08935 06.3 14693 10.4 213089 141074 66.2 10.5% 13% 2.5%
Ja02 09051 06.3 15036 10.5 216506 143228 66.2 10.5% 13% 2.5%
Ja03 09395 06.5 15996 11.0 219897 145301 66.1 11.0% 13% 2.0%
Ja04 09144 06.3 15966 10.9 222161 146068 65.7 10.9% 14% 3.1%
Ja05 08444 05.7 15041 10.2 224837 147125 65.4 10.2% 13% 2.8%
Ja06 07608 05.1 13765 09.2 227553 149090 65.5 09.2% 12% 2.8%
Ja07 07649 05.0 13846 09.1 230650 151924 65.9 09.1% 12% 2.9%
Ja08 08221 05.4 15185 09.9 232616 152828 65.7 09.9% 13% 3.1%
Ja09 13009 08.5 23814 15.5 234739 153445 65.4 15.4% 20% 4.6%
Ja10 16147 10.6 27847 18.2 236832 152957 64.6 18.0% 22% 4.0%
Ja11 14937 09.8 26764 17.5 238704 152536 63.9 17.3% 22.5% 5.2%
Ja12 13541 08.8 25097 16.4 242269 153485 63.4 16.2% 22.5% 6.3%
Ja13 13181 08.5 24130 15.6 244663 154794 63.3 15.4% 23% 7.6%
Ja14 10855 07.0 21064 13.6 246915 154381 62.5 13.5% 23.5% 10%
Ja15 09498 06.1 18857 12.1 249723 156050 62.5 12.0% 23.5% 11.5%
Ja16 08309 05.3 16632 10.6 252397 157347 62.3 10.5% 23% 12.5%
Ja17 08149 05.1 16028 10.1 254082 158676 62.5 10.1% 23% 12.9%
Ja18 07189 04.5 14222 08.9 256780 160037 62.3 08.9% 22% 13.1%
Ja19 07140 04.4 14297 08.8 258239 162104 62.8 08.8% 21.8% 13.0%
Ja20 06504 04.0 12573 07.7 259502 163497 63.0 07.7% 21.0% 13.3%
Ja21 10851 06.8 19188 12.1 260851 159234 61.0 12.0% 25.7% 13.7%
Ja22 07207 04.4 12924 07.9 263202 162825 61.9 07.9% 24.5% 16.6%
Ja18 07189 04.5 14222 08.9 25
NOTIFY: Y | REPLY | REPLY WITH QUOTE | PERMALINK | TOP | HOME
This Table of Data, which breaks down the numerical changes in the key figures.
I will refer to this set of data as Table JSF-URF-6
I will post some actual numbers and let the comparisons and discussion follow.
The BLS uses both Seasonally Adjusted figures and Unadjusted figures, and interchanges them without clearly identifying so. I will use only the Unadjusted numbers, to help maintain clarity and transparency.
Some numbers may have a 0 placed as first digit, to maintain column form in this format.
The 1st column is Labor Force minus both Unemployed and Involuntary Part-Time. This is also Employed minus Involuntary Part-Time. This is not a figure identified by BLS, so I will call it Actually Fully Employed. This is Employed Full-time plus Voluntary Part-Time.
Not listed, but Civilian noninstitutional Population minus Actually Fully Employed is also a figure avoided by BLS, and I will call it Not Fully Employed, which is Unemployed plus Involuntary Part-Time plus Marginally Attached plus Not In Labor Force. The 2nd column is Not Fully Employed Rate, which is divided by Civilian noninstitutional Population.
The 3rd column is the Civilian Population. 4th column is Labor Force, 5th column is Participation Rate.
After the separation bar, the 7th column is the Increase in Civilian Population from the previous entry. For the entries by year, this is the 12 month Increase. For the entries broken down by month, this is the 1 month Increase.
The 8th column is the Increase in Labor Force from the previous entry.
The 9th column is the Increase in Actually Fully Employed count, from the previous entry.
In the monthly breakdown for 2018, after the second separation bar, the 10th column is the Civilian Population Increase from the entry 12 months prior.
The 11th column is the Labor Force Increase from the entry 12 months prior.
The 12th column is the Actually Fully Employed Increase from the entry 12 months prior.
The 13th column is the amount that the 12th column exceeds the 10th column, or the amount of Unemployed that is being chipped away, despite manipulation of other figures.
Figures in thousands.
Mo/Yr AcEmpl NtEm CiviPop LbrFrc Prtc% | CPIn LFIn AEInc
Jan94 114938 41.3% 195953 129393 66.0% |
Jan95 117923 40.4% 197753 130698 66.1% | 1800 1305 02985/+1185
Jan96 119023 40.4% 199634 131396 65.8% | 1881 0698 01100/-0781
Jan97 122046 39.7% 202285 134317 66.4% | 2651 2921 03023/+0372
Jan98 124798 38.9% 204238 135951 66.6% | 1953 1634 02752/+0799
Jan99 127694 38.2% 206719 137943 66.7% | 2481 1992 02896/+0415
Jan00 129950 37.8% 208782 139621 66.9% | 2063 1678 02256/+0193
Jan01 130843 38.0% 210889 141049 66.9% | 2107 1428 00893/-1214
Jan02 127890 40.0% 213089 141074 66.2% | 2200 0025 -2953/-5153
Jan02 129724 40.1% 216506 143228 66.2% | 5617 2179 -1119/-6736
Jan03 130903 40.5% 219897 145301 66.1% | 3391 2073 01179/-2212
Jan04 131772 40.7% 222161 146068 65.7% | 2264 0767 00869/-1395
Jan05 133888 40.5% 224837 147125 65.4% | 2676 1057 02116/-0560
Jan06 136978 39.8% 227553 149090 65.5% | 2716 1965 03090/+0374
Jan07 139655 39.5% 230650 151924 65.9% | 3097 2834 02677/-0420
Jan08 139372 40.1% 232616 152828 65.7% | 1966 0904 -0283/-2249
Jan09 131761 43.9% 234739 153445 65.4% | 2123 0617 -7611/-9734
Jan10 127649 46.1% 236832 152957 64.6% | 2093 -488 -4112/-6205
Jan11 128572 46.1% 238704 152536 63.9% | 1872 -421 00923/-0949
Jan12 131197 45.8% 242269 153485 63.4% | 3565 0949 02625/-0940
Jan13 133107 45.6% 244663 154794 63.3% | 2394 1309 01910/-0484
Jan14 135909 45.0% 246915 154381 62.5% | 2252 -413 02802/+0550
Jan15 139427 44.2% 249723 156050 62.5% | 2808 1669 03518/+0710
Jan16 1428
NOTIFY: Y | REPLY | REPLY WITH QUOTE | PERMALINK | TOP | HOME
Libtard Lockdowns have gone on for 2 years now. Trump was able to recover most of the Economy quickly, but Lord Darth Obiden has continued to strangle jobs.
The Actually Fully Employed count and the Labor Force count have still not returned to the levels of 2 years ago.
While the Civ Pop has increased about 4 million in that time.
For those who may have noticed, I erroneously transcribed some figures, which made the situation look vastly better than it was. I corrected the errors within a day. Sorry for any confusion.
NOTIFY: Y | REPLY | REPLY WITH QUOTE | PERMALINK | TOP | HOME
Updating with Jobs Report data from today:
I will refer to this set of data as Table JSF-URF-1
Jan 2002 is listed twice. First with original report data from February 2002. Second with revised data from new Census data, published in February 2003.
Quote:
Originally posted by JEWELSTAITEFAN:
BLS currently defines the Want A Job category as not being part of the Labor Force.
So I will post some actual numbers and let the comparisons and discussion follow. The documented shenanigans of Obamabots deliberately refusing to Report jobless data in the months before the 2012 Election are a different matter, I will just use the Fake Data they produced and pretend it was real.
I will use only the Unadjusted numbers, to help maintain clarity and transparency.
Mo/Yr Unemp Pcnt WAJb Pcnt SubTtl Pcnt InvPT Pcnt Total Prcnt CivPop LbrFrc Prtc% U-6
Jan98 07069 05.2% 5026 3.7% 12095 08.9% 4090 3.0% 16185 11.9% 204238 135951 66.6 09.3
Jan99 06604 04.8% 4800 3.5% 11404 08.3% 3645 2.6% 15049 10.9% 206719 137943 66.7 08.5
Jan00 06316 04.5% 4354 3.1% 10670 07.6% 3355 2.4% 14025 10.0% 208782 139621 66.9 07.8
Jan01 06647 04.7% 4474 3.2% 11121 07.9% 3559 2.5% 14680 10.4% 210889 141049 66.9 08.1
Jan02 08935 06.3% 4872 3.5% 13807 09.8% 4249 3.0% 18056 12.8% 213089 141074 66.2 10.5
Jan02 09051 06.3% 4938 3.4% 13989 09.8% 4453 3.1% 18442 12.9% 216506 143228 66.2 10.5
Jan03 09395 06.5% 4779 3.3% 14174 09.8% 5003 3.4% 19177 13.2% 219897 145301 66.1 11.0
Jan04 09144 06.3% 4913 3.4% 14057 09.6% 5152 3.5% 19209 13.2% 222161 146068 65.7 10.9
Jan05 08444 05.7% 5136 3.5% 13580 09.2% 4793 3.3% 18373 12.5% 224837 147125 65.4 10.2
Jan06 07608 05.1% 5095 3.4% 12703 08.5% 4513 3.0% 17216 11.5% 227553 149090 65.5 09.2
Jan07 07649 05.0% 4633 3.0% 12282 08.1% 4620 3.0% 16902 11.1% 230650 151924 65.9 09.1
Jan08 08221 05.4% 4977 3.2% 13198 08.6% 5235 3.5% 18433 12.1% 232616 152828 65.7 09.9
Jan09 13009 08.5% 5866 3.8% 18875 12.3% 8675 5.7% 27550 18.0% 234739 153445 65.4 15.4
Jan10 16147 10.6% 6108 4.0% 22255 14.6% 9161 5.9% 31416 20.5% 236832 152957 64.6 18.0
Jan11 14937 09.8% 6643 4.3% 21580 14.1% 9027 6.0% 30607 20.1% 238704 152536 63.9 17.3
Jan12 13541 08.8% 6495 4.3% 20036 13.1% 8747 5.7% 28783 18.8% 242269 153485 63.4 16.2
Jan13 13181 08.5% 6781 4.4% 19962 12.9% 8506 5.5% 28468 18.4% 244663 154794 63.3 15.4
Jan14 10855 07.0% 6508 4.2% 17363 11.2% 7617 5.0% 24980 16.2% 246915 154381 62.5 13.5
Jan15 09498 06.1% 6467 4.1% 15965 10.2% 7125 4.6% 23090 14.8% 249723 156050 62.5 12.0
Jan16 08309 05.3% 6166 3.9% 14475 09.2% 6234 4.0% 20709 13.2% 252397 157347 62.3 10.5
Jan17 08149 05.1% 5934 3.8% 14083 08.9% 6127 3.8% 20210 12.7% 254082 158676 62.5 10.1
Jan18 07189 04.5% 5364 3.3% 12553 07.8% 5380 3.4% 17933 11.2% 256780 160037 62.3 08.9
Jan19 07140 04.4% 5435 3.4% 12575 07.8% 5543 3.4% 18118 11.2% 258239 162104 62.8 08.8
Jan20 06504 04.0% 5107 3.1% 11611 07.1% 4605 2.8% 16216 09.9% 259502 163497 63.0 07.7
Jan21 10851 06.8% 7129 4.5% 17980 11.3% 6284 3.9% 24264 15.2% 260851 159234 61.0 12.0
Jan22 07207 04.4% 5872 3.6% 13079 08.0
NOTIFY: Y | REPLY | REPLY WITH QUOTE | PERMALINK | TOP | HOME
Updating with today's Jobs Report to this Table of Data, which seems to best show the components of U6:
I will refer to this set of data as Table JSF-URF-2
Note: this year the Marginally Attached data is in Table A-16 of the report.
Quote:
I will post some actual numbers and let the comparisons and discussion follow. The documented shenanigans of Obamabots deliberately refusing to Report jobless data in the months before the 2012 Election are a different matter, I will just use the Fake Data they produced and pretend it was real.
The BLS uses both Seasonally Adjusted figures and Unadjusted figures, and interchanges them without clearly identifying so. For example, the current Rate of 4.1% (for 4 months straight) is SeasAdj, and the real Rate is 4.5% for Jan 2018. I will use only the Unadjusted numbers, to help maintain clarity and transparency.
Some numbers may have a 0 placed as first digit, to maintain column form in this format.
The 1st column of numbers is the unemployed. The 2nd column is the Rate.
The 3rd column is what is called Marginally Attached to the Labor Force, which is included in the Want A Job Now category but NOT included in the Labor Force category and therefore excluded from the reported Unemployment category. The 5th column is the sum of Unemployed plus Marginally Attached - which more accurately represents the Actual Unemployed. The 6th column is the Rate for column 5 figure.
The 7th column is the Involuntary Part-Time workers, who are Not Employed Full Time due to poor Economy, and want, are able to work FT. The 8th column is the Rate for column 7. The 9th column is the sum of the 5th column plus 7th column. 10th column is the Rate for column 9 figure. The Rates in columns 2, 4, 6, 8, 10 have the denominator of Labor Force.
The 11th column is the Civilian Population. 12th column is Labor Force, 13th column is Participation Rate. 14th column is the published U-6 figure.
Figures in thousands.
MoYr Unemp Pct MrgAt Pct SbTtl Pct InvPT Pct Total Pcnt CivPop LbrFrc Prtc% U6%
Ja93 09911 07.9 2120 1.6 11612 09.0 6181 4.9 16575 12.8 192644 126034 65.4
Ja94 09492 07.3 2120 1.6 11612 09.0 4963 3.8 16575 12.8 195953 129393 66.0
Ja95 08101 06.2 1783 1.4 09884 07.6 4620 3.5 14504 11.1 197753 130698 66.1
Ja96 08270 06.3 1737 1.3 10007 07.6 4103 3.1 14110 10.7 199634 131396 65.8 10.8
Ja97 07933 05.9 1615 1.2 09548 07.1 4338 3.2 13886 10.3 202285 134317 66.4 10.4
Ja98 07069 05.2 1479 1.1 08548 06.3 4090 3.0 12638 09.3 204238 135951 66.6 09.3
Ja99 06604 04.8 1358 1.0 07962 05.8 3645 2.6 11607 08.4 206719 137943 66.7 08.5
Ja00 06316 04.5 1197 0.9 07513 05.4 3355 2.4 10868 07.8 208782 139621 66.9 07.8
Ja01 06647 04.7 1290 0.9 07937 05.6 3559 2.5 11496 08.2 210889 141049 66.9 08.1
Ja02 08935 06.3 1509 1.1 10444 07.4 4249 3.0 14693 10.4 213089 141074 66.2 10.5
Ja02 09051 06.3 1532 1.1 10583 07.4 4453 3.1 15036 10.5 216506 143228 66.2 10.5
Ja03 09395 06.5 1598 1.1 10993 07.6 5003 3.4 15996 11.0 219897 145301 66.1 11.0
Ja04 09144 06.3 1670 1.1 10814 07.4 5152 3.5 15966 10.9 222161 146068 65.7 10.9
Ja05 08444 05.7 1804 1.2 10248 07.0 4793 3.3 15041 10.2 224837 147125 65.4 10.2
Ja06 07608 05.1 1644 1.1 09252 06.2 4513 3.0 13765 09.2 227553 149090 65.5 09.2
Ja07 07649 05.0 1577 1.0 09226 06.1 4620 3.0 13846 09.1 230650 151924 65.9 09.1
Ja08 08221 05.4 1729 1.1 09950 06.5 5235 3.4 15185 09.9 232616 152828 65.7 09.9
Ja09 13009 08.5 2130 1.4 15139 09.9 8675 5.6 23814 15.5 234739 153445 65.4 15.4
Ja10 16147 10.6 2539 1.6 18686 12.2 9161 6.0 27847 18.2 236832 152957 64.6 18.0
Ja11 14937 09.8 2800 1.8 17737 11.6 9027 5.9 26764 17.5 238704 152536 63.9 17.3
Ja12 13541 08.8 2809 1.9 16350 10.7 8747 5.7 25097 16.4 242269 153485 63.4 16.2
Ja13 13181 08.5 2443 1.6 15624 10.1 8506 5.5 24130 15.6 244663 154794 63.3 15.4
Ja14 10855 07.0 2592 1.7 13447 08.7 7617 4.9
NOTIFY: Y | REPLY | REPLY WITH QUOTE | PERMALINK | TOP | HOME
This Table of Data, which includes Not Fully Employed Rate.
I will refer to this set of data as Table JSF-URF-3
I will post some actual numbers and let the comparisons and discussion follow.
The BLS uses both Seasonally Adjusted figures and Unadjusted figures, and interchanges them without clearly identifying so. I will use only the Unadjusted numbers, to help maintain clarity and transparency.
Some numbers may have a 0 placed as first digit, to maintain column form in this format.
The 1st column of numbers is the Unemployed.
The 2nd column is what is called Marginally Attached to the Labor Force, which is included in the Want A Job Now category but NOT included in the Labor Force category and therefore excluded from the reported Unemployment category.
The 3rd column is the Involuntary Part-Time workers, who are Not Employed Full Time due to poor Economy, and want, are able to work FT. The 4th column of numbers is the sum of the 1st, 2nd, and 3rd columns. 5th column is the Rate for column 4 figure, divided by Labor Force.
The 6th column of numbers is the Subtotal of columns 1 and 3, Unemployed plus Involuntary Part-Time.
The 7th column is Labor Force minus column 6. This is also Employed minus column 3 Involuntary Part-Time. This is not a figure identified by BLS, so I will call it Actually Fully Employed. This is Employed Full-time plus Voluntary Part-Time.
Not listed, but Civilian noninstitutional Population minus Actually Fully Employed is also a figure avoided by BLS, and I will call it Not Fully Employed, which is Unemployed plus Involuntary Part-Time plus Marginally Attached plus Not In Labor Force. The 8th column is Not Fully Employed Rate, which is divided by Civilian noninstitutional Population.
The 9th column is the Civilian Population. 10th column is Labor Force, 11th column is Participation Rate. 12th column is the published U-6 figure.
Figures in thousands.
Mo/Yr Unem MrgAt InvPT Totl Prct SbTtl AcEmpl NotEm CivPop LbrForc Prtc% U6%
Jan94 09492 2120 4963 16575 12.8 14455 114938 41.3% 195953 129393 66.0
Jan95 08101 1783 4620 14504 11.1 12721 117923 40.4% 197753 130698 66.1
Jan96 08270 1737 4103 14110 10.7 12373 119023 40.4% 199634 131396 65.8 10.8
Jan97 07933 1615 4338 13886 10.3 12271 122046 39.7% 202285 134317 66.4 10.4
Jan98 07069 1479 4090 12638 09.3 11159 124798 38.9% 204238 135951 66.6 09.3
Jan99 06604 1358 3645 11607 08.4 10249 127694 38.2% 206719 137943 66.7 08.5
Jan00 06316 1197 3355 10868 07.8 09671 129950 37.8% 208782 139621 66.9 07.8
Jan01 06647 1290 3559 11496 08.2 10206 130843 38.0% 210889 141049 66.9 08.1
Jan02 08935 1509 4249 14693 10.4 13184 127890 40.0% 213089 141074 66.2 10.5
Jan02 09051 1532 4453 15036 10.5 13504 129724 40.1% 216506 143228 66.2 10.5
Jan03 09395 1598 5003 15996 11.0 14398 130903 40.5% 219897 145301 66.1 11.0
Jan04 09144 1670 5152 15966 10.9 14296 131772 40.7% 222161 146068 65.7 10.9
Jan05 08444 1804 4793 15041 10.2 13237 133888 40.5% 224837 147125 65.4 10.2
Jan06 07608 1644 4513 13765 09.2 12122 136978 39.8% 227553 149090 65.5 09.2
Jan07 07649 1577 4620 13846 09.1 12269 139655 39.5% 230650 151924 65.9 09.1
Jan08 08221 1729 5235 15185 09.9 13456 139372 40.1% 232616 152828 65.7 09.9
Jan09 13009 2130 8675 23814 15.5 21684 131761 43.9% 234739 153445 65.4 15.4
Jan10 16147 2539 9161 27847 18.2 25308 127649 46.1% 236832 152957 64.6 18.0
Jan11 14937 2800 9027 26764 17.5 23964 128572 46.1% 238704 152536 63.9 17.3
Jan12 13541 2809 8747 25097 16.4 22288 131197 45.8% 242269 153485 63.4 16.2
Jan13 13181 2443 8506 24130 15.6 21687 133107 45.6% 244663 154794 63.3 15.4
Jan14 10855 2592 7617 21064 13.6 18472 135909 45.0% 246915 154381 62.5 13.5
Jan15 09498 2234 7125 18
NOTIFY: Y | REPLY | REPLY WITH QUOTE | PERMALINK | TOP | HOME
The shadowstats site is lean on actual data, requiring a subscription to access what it claims as database.
However, I will make attempt to add in some of the data it presents. This does make assumption that their methodology and counting methods are valid, which I cannot find clear information about.
There also may be comingling of Seasonally Adjusted figures from shadowstats without clarity, but this will be the only series of Tables I post which veer from Not Seasonally Adjusted figures.
The charts they present do show that Unemployment under Trump is better than any time under Obamanomics, so it may be a worthwhile endeavor to investigate.
I will refer to this set of data as Table JSF-URF-5
I will post some actual numbers and let the comparisons and discussion follow. The documented shenanigans of Obamabots deliberately refusing to Report jobless data in the months before the 2012 Election are a different matter, I will just use the Fake Data they produced and pretend it was real.
The 1st column of numbers is the unemployed. The 2nd column is the Rate.
The 3rd column is the sum of the Unemployed plus Marginally Attached plus Involuntary Part-time. 4th column is the Rate for column 3 figure. The Rates in columns 2 and 4 have the denominator of Labor Force.
The 5th column is the Civilian Population. 6th column is Labor Force, 7th column is Participation Rate. 8th column is the published U-6 figure.
The 9th column is the Real Unemployment figure, as presented by shadowstats. The 10th column is the underreported, the difference between the U-6 figure from BLS and the Real figure from shadowstats.
Figures in thousands.
MoYr Unem Pcnt Total Prcnt CivPop LbrForc Prtc% U6% Real Separation
Ja93 09911 07.9 16575 12.8 192644 126034 65.4
Ja94 09492 07.3 16575 12.8 195953 129393 66.0 12% 15.3% 2.3%
Ja95 08101 06.2 14504 11.1 197753 130698 66.1 10% 13.5% 3.5%
Ja96 08270 06.3 14110 10.7 199634 131396 65.8 10.8% 13.5% 2.7%
Ja97 07933 05.9 13886 10.3 202285 134317 66.4 10.4% 13% 2.6%
Ja98 07069 05.2 12638 09.3 204238 135951 66.6 09.3% 12% 2.7%
Ja99 06604 04.8 11607 08.4 206719 137943 66.7 08.5% 11.5% 3.0%
Ja00 06316 04.5 10868 07.8 208782 139621 66.9 07.8% 11% 3.2%
Ja01 06647 04.7 11496 08.2 210889 141049 66.9 08.1% 10.5% 2.4%
Ja02 08935 06.3 14693 10.4 213089 141074 66.2 10.5% 13% 2.5%
Ja02 09051 06.3 15036 10.5 216506 143228 66.2 10.5% 13% 2.5%
Ja03 09395 06.5 15996 11.0 219897 145301 66.1 11.0% 13% 2.0%
Ja04 09144 06.3 15966 10.9 222161 146068 65.7 10.9% 14% 3.1%
Ja05 08444 05.7 15041 10.2 224837 147125 65.4 10.2% 13% 2.8%
Ja06 07608 05.1 13765 09.2 227553 149090 65.5 09.2% 12% 2.8%
Ja07 07649 05.0 13846 09.1 230650 151924 65.9 09.1% 12% 2.9%
Ja08 08221 05.4 15185 09.9 232616 152828 65.7 09.9% 13% 3.1%
Ja09 13009 08.5 23814 15.5 234739 153445 65.4 15.4% 20% 4.6%
Ja10 16147 10.6 27847 18.2 236832 152957 64.6 18.0% 22% 4.0%
Ja11 14937 09.8 26764 17.5 238704 152536 63.9 17.3% 22.5% 5.2%
Ja12 13541 08.8 25097 16.4 242269 153485 63.4 16.2% 22.5% 6.3%
Ja13 13181 08.5 24130 15.6 244663 154794 63.3 15.4% 23% 7.6%
Ja14 10855 07.0 21064 13.6 246915 154381 62.5 13.5% 23.5% 10%
Ja15 09498 06.1 18857 12.1 249723 156050 62.5 12.0% 23.5% 11.5%
Ja16 08309 05.3 16632 10.6 252397 157347 62.3 10.5% 23% 12.5%
Ja17 08149 05.1 16028 10.1 254082 158676 62.5 10.1% 23% 12.9%
Ja18 07189 04.5 14222 08.9 256780 160037 62.3 08.9% 22% 13.1%
Ja19 07140 04.4 14297 08.8 258239 162104 62.8 08.8% 21.8% 13.0%
Ja20 06504 04.0 12573 07.7 259502 163497 63.0 07.7% 21.0% 13.3%
Ja21 10851 06.8 19188 12.1 260851 159234 61.0 12.0% 25.7% 13.7%
Ja22 07207 04.4 12924 07.9 263202 162825 61.9 07.9% 24.5% 16.6%
Ja18 07189 04.5 14222 08.9 25
NOTIFY: Y | REPLY | REPLY WITH QUOTE | PERMALINK | TOP | HOME
This Table of Data, which breaks down the numerical changes in the key figures.
I will refer to this set of data as Table JSF-URF-6
I will post some actual numbers and let the comparisons and discussion follow.
The BLS uses both Seasonally Adjusted figures and Unadjusted figures, and interchanges them without clearly identifying so. I will use only the Unadjusted numbers, to help maintain clarity and transparency.
Some numbers may have a 0 placed as first digit, to maintain column form in this format.
The 1st column is Labor Force minus both Unemployed and Involuntary Part-Time. This is also Employed minus Involuntary Part-Time. This is not a figure identified by BLS, so I will call it Actually Fully Employed. This is Employed Full-time plus Voluntary Part-Time.
Not listed, but Civilian noninstitutional Population minus Actually Fully Employed is also a figure avoided by BLS, and I will call it Not Fully Employed, which is Unemployed plus Involuntary Part-Time plus Marginally Attached plus Not In Labor Force. The 2nd column is Not Fully Employed Rate, which is divided by Civilian noninstitutional Population.
The 3rd column is the Civilian Population. 4th column is Labor Force, 5th column is Participation Rate.
After the separation bar, the 7th column is the Increase in Civilian Population from the previous entry. For the entries by year, this is the 12 month Increase. For the entries broken down by month, this is the 1 month Increase.
The 8th column is the Increase in Labor Force from the previous entry.
The 9th column is the Increase in Actually Fully Employed count, from the previous entry.
In the monthly breakdown for 2018, after the second separation bar, the 10th column is the Civilian Population Increase from the entry 12 months prior.
The 11th column is the Labor Force Increase from the entry 12 months prior.
The 12th column is the Actually Fully Employed Increase from the entry 12 months prior.
The 13th column is the amount that the 12th column exceeds the 10th column, or the amount of Unemployed that is being chipped away, despite manipulation of other figures.
Figures in thousands.
Mo/Yr AcEmpl NtEm CiviPop LbrFrc Prtc% | CPIn LFIn AEInc
Jan94 114938 41.3% 195953 129393 66.0% |
Jan95 117923 40.4% 197753 130698 66.1% | 1800 1305 02985/+1185
Jan96 119023 40.4% 199634 131396 65.8% | 1881 0698 01100/-0781
Jan97 122046 39.7% 202285 134317 66.4% | 2651 2921 03023/+0372
Jan98 124798 38.9% 204238 135951 66.6% | 1953 1634 02752/+0799
Jan99 127694 38.2% 206719 137943 66.7% | 2481 1992 02896/+0415
Jan00 129950 37.8% 208782 139621 66.9% | 2063 1678 02256/+0193
Jan01 130843 38.0% 210889 141049 66.9% | 2107 1428 00893/-1214
Jan02 127890 40.0% 213089 141074 66.2% | 2200 0025 -2953/-5153
Jan02 129724 40.1% 216506 143228 66.2% | 5617 2179 -1119/-6736
Jan03 130903 40.5% 219897 145301 66.1% | 3391 2073 01179/-2212
Jan04 131772 40.7% 222161 146068 65.7% | 2264 0767 00869/-1395
Jan05 133888 40.5% 224837 147125 65.4% | 2676 1057 02116/-0560
Jan06 136978 39.8% 227553 149090 65.5% | 2716 1965 03090/+0374
Jan07 139655 39.5% 230650 151924 65.9% | 3097 2834 02677/-0420
Jan08 139372 40.1% 232616 152828 65.7% | 1966 0904 -0283/-2249
Jan09 131761 43.9% 234739 153445 65.4% | 2123 0617 -7611/-9734
Jan10 127649 46.1% 236832 152957 64.6% | 2093 -488 -4112/-6205
Jan11 128572 46.1% 238704 152536 63.9% | 1872 -421 00923/-0949
Jan12 131197 45.8% 242269 153485 63.4% | 3565 0949 02625/-0940
Jan13 133107 45.6% 244663 154794 63.3% | 2394 1309 01910/-0484
Jan14 135909 45.0% 246915 154381 62.5% | 2252 -413 02802/+0550
Jan15 139427 44.2% 249723 156050 62.5% | 2808 1669 03518/+0710
Jan16 14
NOTIFY: Y | REPLY | REPLY WITH QUOTE | PERMALINK | TOP | HOME
Employers continue to complain that they can't find enough workers, but apparently the real problem is that they like their current profit levels more than they like the idea of expanding production by paying higher wages to attract more job applicants.
The ECI (employment cost index) is a measure of the total cost of employment, and it's been going down since the start of the pandemic. In 2021 it dropped two full percentage points. This chart goes through the end of 2021. Data for the first quarter of 2022 will be available at the end of April.
Employers are paying workers less and less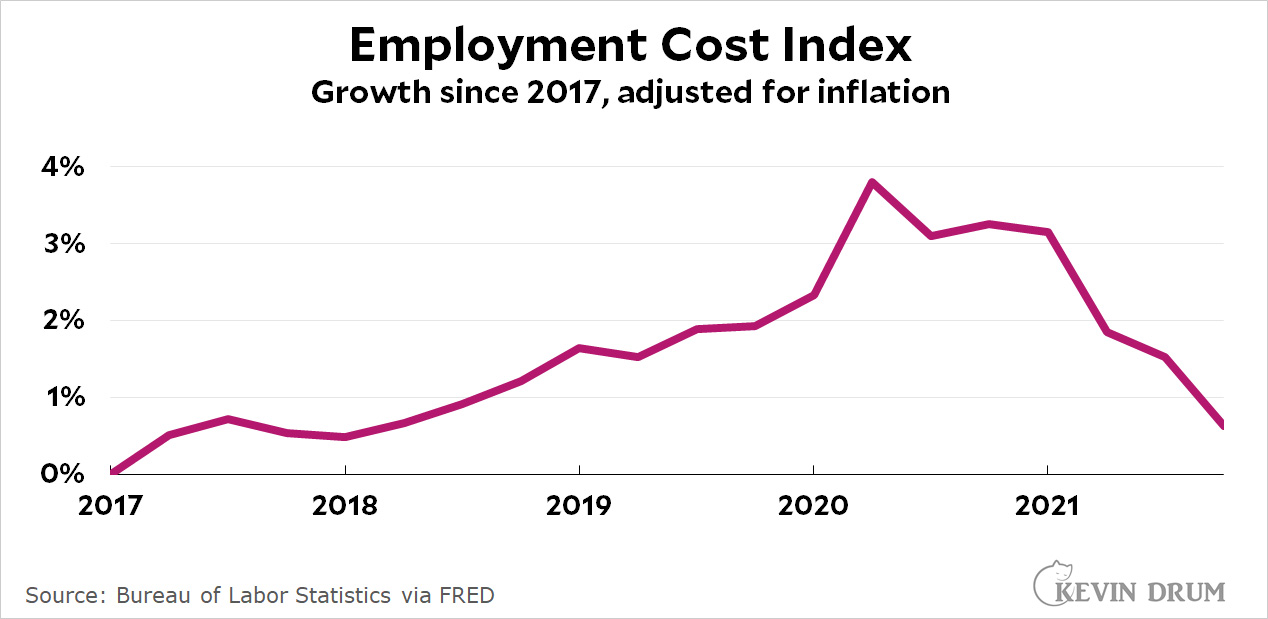
https://jabberwocking.com/raw-data-employers-are-paying-workers-less-a
nd-less/
The Joss Whedon script for Serenity, where Wash lives, is Serenity-190pages.pdf at https://www.mediafire.com/two
NOTIFY: Y | REPLY | REPLY WITH QUOTE | PERMALINK | TOP | HOME
Quote:Looks like steady rising under Trump. And then even Libtard Lockdowns couldn't bring it down.
Originally posted by second:
Employers continue to complain that they can't find enough workers, but apparently the real problem is that they like their current profit levels more than they like the idea of expanding production by paying higher wages to attract more job applicants.
The ECI (employment cost index) is a measure of the total cost of employment, and it's been going down since the start of the pandemic. In 2021 it dropped two full percentage points. This chart goes through the end of 2021. Data for the first quarter of 2022 will be available at the end of April.
Employers are paying workers less and less
https://jabberwocking.com/raw-data-employers-are-paying-workers-less-a
nd-less/
But then Lord Darth Obiden took over, and it dropped like a rock.
Shockers.
NOTIFY: Y | REPLY | REPLY WITH QUOTE | PERMALINK | TOP | HOME
Quote:If only Trump had been President, Congress would have raised the minimum wage, since the GOP is eager to do so. Alas, the GOP couldn't raise the wage because every Democrat in the Senate was opposed. Or maybe it was every GOP Senator opposed? It is so confusing! Or maybe it is not.
Originally posted by JEWELSTAITEFAN:
Looks like steady rising under Trump. And then even Libtard Lockdowns couldn't bring it down.
But then Lord Darth Obiden took over, and it dropped like a rock.
Shockers.
Why did the minimum wage law in congress not pass?
https://www.google.com/search?q=why+did+the+minimum+wage+law+in+congre
ss+not+pass
The Joss Whedon script for Serenity, where Wash lives, is Serenity-190pages.pdf at https://www.mediafire.com/two
NOTIFY: Y | REPLY | REPLY WITH QUOTE | PERMALINK | TOP | HOME
Tomorrow the Jobs Report comes out.
However, for more than a month I've heard Lord Darth Obiden claim that he has created 7 million jobs.
Despite the fact that his Labor Force continues to be less than the many months which Trump had greater than the current count.
And the Actually Fully Employed count (JSF Tables 3 and 6) continues to be several million less than Trump created.
NOTIFY: Y | REPLY | REPLY WITH QUOTE | PERMALINK | TOP | HOME
Quote:
Originally posted by JEWELSTAITEFAN:
Tomorrow the Jobs Report comes out.
However, for more than a month I've heard Lord Darth Obiden claim that he has created 7 million jobs.
Despite the fact that his Labor Force continues to be less than the many months which Trump had greater than the current count.
And the Actually Fully Employed count (JSF Tables 3 and 6) continues to be several million less than Trump created.
Gotta love the lies and the spin.
I guess the Legacy media has forgotten that at one point we lost 22 Million jobs when they told tens of millions of people that what they did for a living was non-essential.
Get fucked, Libs.
--------------------------------------------------
Me: "Remember Covid?"
Useless Idiots: "What's Covid, durr? Russia, Ukraine, Putin, NATO *drool*. DURRRR!!!!"
NOTIFY: Y | REPLY | REPLY WITH QUOTE | PERMALINK | TOP | HOME
Quote:I should have pointed out that even since his Regime started in Jan 2021, Labor Force has ssslllloooowwwwwwllllyyy increased to 5 million more as of last month.
Originally posted by 6IXSTRINGJACK:Quote:Gotta love the lies and the spin.
Originally posted by JEWELSTAITEFAN:
Tomorrow the Jobs Report comes out.
However, for more than a month I've heard Lord Darth Obiden claim that he has created 7 million jobs.
Despite the fact that his Labor Force continues to be less than the many months which Trump had greater than the current count.
And the Actually Fully Employed count (JSF Tables 3 and 6) continues to be several million less than Trump created.
I guess the Legacy media has forgotten that at one point we lost 22 Million jobs when they told tens of millions of people that what they did for a living was non-essential.
Get fucked, Libs.
Still no idea where 7 million comes from. But that's OK, he doesn't know either.
NOTIFY: Y | REPLY | REPLY WITH QUOTE | PERMALINK | TOP | HOME

https://www.factcheck.org/2022/01/bidens-numbers/
Unlike MSM or any source with paid sponsors, they don't flinch when it comes rating Biden/presidents up or down. The part where people stumble (or lie to suit their own desires) is in attributing the "why" to any of these moves.
NOTIFY: Y | REPLY | REPLY WITH QUOTE | PERMALINK | TOP | HOME
LOL
--------------------------------------------------
Me: "Remember Covid?"
Useless Idiots: "What's Covid, durr? Russia, Ukraine, Putin, NATO *drool*. DURRRR!!!!"
NOTIFY: Y | REPLY | REPLY WITH QUOTE | PERMALINK | TOP | HOME
Updating with Jobs Report data from today:
I will refer to this set of data as Table JSF-URF-1
Jan 2002 is listed twice. First with original report data from February 2002. Second with revised data from new Census data, published in February 2003.
Quote:
Originally posted by JEWELSTAITEFAN:
BLS currently defines the Want A Job category as not being part of the Labor Force.
So I will post some actual numbers and let the comparisons and discussion follow. The documented shenanigans of Obamabots deliberately refusing to Report jobless data in the months before the 2012 Election are a different matter, I will just use the Fake Data they produced and pretend it was real.
I will use only the Unadjusted numbers, to help maintain clarity and transparency.
Mo/Yr Unemp Pcnt WAJb Pcnt SubTtl Pcnt InvPT Pcnt Total Prcnt CivPop LbrFrc Prtc% U-6
Jan98 07069 05.2% 5026 3.7% 12095 08.9% 4090 3.0% 16185 11.9% 204238 135951 66.6 09.3
Jan99 06604 04.8% 4800 3.5% 11404 08.3% 3645 2.6% 15049 10.9% 206719 137943 66.7 08.5
Jan00 06316 04.5% 4354 3.1% 10670 07.6% 3355 2.4% 14025 10.0% 208782 139621 66.9 07.8
Jan01 06647 04.7% 4474 3.2% 11121 07.9% 3559 2.5% 14680 10.4% 210889 141049 66.9 08.1
Jan02 08935 06.3% 4872 3.5% 13807 09.8% 4249 3.0% 18056 12.8% 213089 141074 66.2 10.5
Jan02 09051 06.3% 4938 3.4% 13989 09.8% 4453 3.1% 18442 12.9% 216506 143228 66.2 10.5
Jan03 09395 06.5% 4779 3.3% 14174 09.8% 5003 3.4% 19177 13.2% 219897 145301 66.1 11.0
Jan04 09144 06.3% 4913 3.4% 14057 09.6% 5152 3.5% 19209 13.2% 222161 146068 65.7 10.9
Jan05 08444 05.7% 5136 3.5% 13580 09.2% 4793 3.3% 18373 12.5% 224837 147125 65.4 10.2
Jan06 07608 05.1% 5095 3.4% 12703 08.5% 4513 3.0% 17216 11.5% 227553 149090 65.5 09.2
Jan07 07649 05.0% 4633 3.0% 12282 08.1% 4620 3.0% 16902 11.1% 230650 151924 65.9 09.1
Jan08 08221 05.4% 4977 3.2% 13198 08.6% 5235 3.5% 18433 12.1% 232616 152828 65.7 09.9
Jan09 13009 08.5% 5866 3.8% 18875 12.3% 8675 5.7% 27550 18.0% 234739 153445 65.4 15.4
Jan10 16147 10.6% 6108 4.0% 22255 14.6% 9161 5.9% 31416 20.5% 236832 152957 64.6 18.0
Jan11 14937 09.8% 6643 4.3% 21580 14.1% 9027 6.0% 30607 20.1% 238704 152536 63.9 17.3
Jan12 13541 08.8% 6495 4.3% 20036 13.1% 8747 5.7% 28783 18.8% 242269 153485 63.4 16.2
Jan13 13181 08.5% 6781 4.4% 19962 12.9% 8506 5.5% 28468 18.4% 244663 154794 63.3 15.4
Jan14 10855 07.0% 6508 4.2% 17363 11.2% 7617 5.0% 24980 16.2% 246915 154381 62.5 13.5
Jan15 09498 06.1% 6467 4.1% 15965 10.2% 7125 4.6% 23090 14.8% 249723 156050 62.5 12.0
Jan16 08309 05.3% 6166 3.9% 14475 09.2% 6234 4.0% 20709 13.2% 252397 157347 62.3 10.5
Jan17 08149 05.1% 5934 3.8% 14083 08.9% 6127 3.8% 20210 12.7% 254082 158676 62.5 10.1
Jan18 07189 04.5% 5364 3.3% 12553 07.8% 5380 3.4% 17933 11.2% 256780 160037 62.3 08.9
Jan19 07140 04.4% 5435 3.4% 12575 07.8% 5543 3.4% 18118 11.2% 258239 162104 62.8 08.8
Jan20 06504 04.0% 5107 3.1% 11611 07.1% 4605 2.8% 16216 09.9% 259502 163497 63.0 07.7
Jan21 10851 06.8% 7129 4.5% 17980 11.3% 6284 3.9% 24264 15.2% 260851 159234 61.0 12.0
Jan22 07207 04.4% 5872 3.6% 13079 08.0%
NOTIFY: Y | REPLY | REPLY WITH QUOTE | PERMALINK | TOP | HOME
Updating with today's Jobs Report to this Table of Data, which seems to best show the components of U6:
I will refer to this set of data as Table JSF-URF-2
Note: this year the Marginally Attached data is in Table A-16 of the report.
Quote:
I will post some actual numbers and let the comparisons and discussion follow. The documented shenanigans of Obamabots deliberately refusing to Report jobless data in the months before the 2012 Election are a different matter, I will just use the Fake Data they produced and pretend it was real.
The BLS uses both Seasonally Adjusted figures and Unadjusted figures, and interchanges them without clearly identifying so. For example, the current Rate of 4.1% (for 4 months straight) is SeasAdj, and the real Rate is 4.5% for Jan 2018. I will use only the Unadjusted numbers, to help maintain clarity and transparency.
Some numbers may have a 0 placed as first digit, to maintain column form in this format.
The 1st column of numbers is the unemployed. The 2nd column is the Rate.
The 3rd column is what is called Marginally Attached to the Labor Force, which is included in the Want A Job Now category but NOT included in the Labor Force category and therefore excluded from the reported Unemployment category. The 5th column is the sum of Unemployed plus Marginally Attached - which more accurately represents the Actual Unemployed. The 6th column is the Rate for column 5 figure.
The 7th column is the Involuntary Part-Time workers, who are Not Employed Full Time due to poor Economy, and want, are able to work FT. The 8th column is the Rate for column 7. The 9th column is the sum of the 5th column plus 7th column. 10th column is the Rate for column 9 figure. The Rates in columns 2, 4, 6, 8, 10 have the denominator of Labor Force.
The 11th column is the Civilian Population. 12th column is Labor Force, 13th column is Participation Rate. 14th column is the published U-6 figure.
Figures in thousands.
MoYr Unemp Pct MrgAt Pct SbTtl Pct InvPT Pct Total Pcnt CivPop LbrFrc Prtc% U6%
Ja93 09911 07.9 2120 1.6 11612 09.0 6181 4.9 16575 12.8 192644 126034 65.4
Ja94 09492 07.3 2120 1.6 11612 09.0 4963 3.8 16575 12.8 195953 129393 66.0
Ja95 08101 06.2 1783 1.4 09884 07.6 4620 3.5 14504 11.1 197753 130698 66.1
Ja96 08270 06.3 1737 1.3 10007 07.6 4103 3.1 14110 10.7 199634 131396 65.8 10.8
Ja97 07933 05.9 1615 1.2 09548 07.1 4338 3.2 13886 10.3 202285 134317 66.4 10.4
Ja98 07069 05.2 1479 1.1 08548 06.3 4090 3.0 12638 09.3 204238 135951 66.6 09.3
Ja99 06604 04.8 1358 1.0 07962 05.8 3645 2.6 11607 08.4 206719 137943 66.7 08.5
Ja00 06316 04.5 1197 0.9 07513 05.4 3355 2.4 10868 07.8 208782 139621 66.9 07.8
Ja01 06647 04.7 1290 0.9 07937 05.6 3559 2.5 11496 08.2 210889 141049 66.9 08.1
Ja02 08935 06.3 1509 1.1 10444 07.4 4249 3.0 14693 10.4 213089 141074 66.2 10.5
Ja02 09051 06.3 1532 1.1 10583 07.4 4453 3.1 15036 10.5 216506 143228 66.2 10.5
Ja03 09395 06.5 1598 1.1 10993 07.6 5003 3.4 15996 11.0 219897 145301 66.1 11.0
Ja04 09144 06.3 1670 1.1 10814 07.4 5152 3.5 15966 10.9 222161 146068 65.7 10.9
Ja05 08444 05.7 1804 1.2 10248 07.0 4793 3.3 15041 10.2 224837 147125 65.4 10.2
Ja06 07608 05.1 1644 1.1 09252 06.2 4513 3.0 13765 09.2 227553 149090 65.5 09.2
Ja07 07649 05.0 1577 1.0 09226 06.1 4620 3.0 13846 09.1 230650 151924 65.9 09.1
Ja08 08221 05.4 1729 1.1 09950 06.5 5235 3.4 15185 09.9 232616 152828 65.7 09.9
Ja09 13009 08.5 2130 1.4 15139 09.9 8675 5.6 23814 15.5 234739 153445 65.4 15.4
Ja10 16147 10.6 2539 1.6 18686 12.2 9161 6.0 27847 18.2 236832 152957 64.6 18.0
Ja11 14937 09.8 2800 1.8 17737 11.6 9027 5.9 26764 17.5 238704 152536 63.9 17.3
Ja12 13541 08.8 2809 1.9 16350 10.7 8747 5.7 25097 16.4 242269 153485 63.4 16.2
Ja13 13181 08.5 2443 1.6 15624 10.1 8506 5.5 24130 15.6 244663 154794 63.3 15.4
Ja14 10855 07.0 2592 1.7 13447 08.7 7617 4.9 2
NOTIFY: Y | REPLY | REPLY WITH QUOTE | PERMALINK | TOP | HOME
This Table of Data, which includes Not Fully Employed Rate.
I will refer to this set of data as Table JSF-URF-3
I will post some actual numbers and let the comparisons and discussion follow.
The BLS uses both Seasonally Adjusted figures and Unadjusted figures, and interchanges them without clearly identifying so. I will use only the Unadjusted numbers, to help maintain clarity and transparency.
Some numbers may have a 0 placed as first digit, to maintain column form in this format.
The 1st column of numbers is the Unemployed.
The 2nd column is what is called Marginally Attached to the Labor Force, which is included in the Want A Job Now category but NOT included in the Labor Force category and therefore excluded from the reported Unemployment category.
The 3rd column is the Involuntary Part-Time workers, who are Not Employed Full Time due to poor Economy, and want, are able to work FT. The 4th column of numbers is the sum of the 1st, 2nd, and 3rd columns. 5th column is the Rate for column 4 figure, divided by Labor Force.
The 6th column of numbers is the Subtotal of columns 1 and 3, Unemployed plus Involuntary Part-Time.
The 7th column is Labor Force minus column 6. This is also Employed minus column 3 Involuntary Part-Time. This is not a figure identified by BLS, so I will call it Actually Fully Employed. This is Employed Full-time plus Voluntary Part-Time.
Not listed, but Civilian noninstitutional Population minus Actually Fully Employed is also a figure avoided by BLS, and I will call it Not Fully Employed, which is Unemployed plus Involuntary Part-Time plus Marginally Attached plus Not In Labor Force. The 8th column is Not Fully Employed Rate, which is divided by Civilian noninstitutional Population.
The 9th column is the Civilian Population. 10th column is Labor Force, 11th column is Participation Rate. 12th column is the published U-6 figure.
Figures in thousands.
Mo/Yr Unem MrgAt InvPT Totl Prct SbTtl AcEmpl NotEm CivPop LbrForc Prtc% U6%
Jan94 09492 2120 4963 16575 12.8 14455 114938 41.3% 195953 129393 66.0
Jan95 08101 1783 4620 14504 11.1 12721 117923 40.4% 197753 130698 66.1
Jan96 08270 1737 4103 14110 10.7 12373 119023 40.4% 199634 131396 65.8 10.8
Jan97 07933 1615 4338 13886 10.3 12271 122046 39.7% 202285 134317 66.4 10.4
Jan98 07069 1479 4090 12638 09.3 11159 124798 38.9% 204238 135951 66.6 09.3
Jan99 06604 1358 3645 11607 08.4 10249 127694 38.2% 206719 137943 66.7 08.5
Jan00 06316 1197 3355 10868 07.8 09671 129950 37.8% 208782 139621 66.9 07.8
Jan01 06647 1290 3559 11496 08.2 10206 130843 38.0% 210889 141049 66.9 08.1
Jan02 08935 1509 4249 14693 10.4 13184 127890 40.0% 213089 141074 66.2 10.5
Jan02 09051 1532 4453 15036 10.5 13504 129724 40.1% 216506 143228 66.2 10.5
Jan03 09395 1598 5003 15996 11.0 14398 130903 40.5% 219897 145301 66.1 11.0
Jan04 09144 1670 5152 15966 10.9 14296 131772 40.7% 222161 146068 65.7 10.9
Jan05 08444 1804 4793 15041 10.2 13237 133888 40.5% 224837 147125 65.4 10.2
Jan06 07608 1644 4513 13765 09.2 12122 136978 39.8% 227553 149090 65.5 09.2
Jan07 07649 1577 4620 13846 09.1 12269 139655 39.5% 230650 151924 65.9 09.1
Jan08 08221 1729 5235 15185 09.9 13456 139372 40.1% 232616 152828 65.7 09.9
Jan09 13009 2130 8675 23814 15.5 21684 131761 43.9% 234739 153445 65.4 15.4
Jan10 16147 2539 9161 27847 18.2 25308 127649 46.1% 236832 152957 64.6 18.0
Jan11 14937 2800 9027 26764 17.5 23964 128572 46.1% 238704 152536 63.9 17.3
Jan12 13541 2809 8747 25097 16.4 22288 131197 45.8% 242269 153485 63.4 16.2
Jan13 13181 2443 8506 24130 15.6 21687 133107 45.6% 244663 154794 63.3 15.4
Jan14 10855 2592 7617 21064 13.6 18472 135909 45.0% 246915 154381 62.5 13.5
Jan15 09498 2234 7125 1885
NOTIFY: Y | REPLY | REPLY WITH QUOTE | PERMALINK | TOP | HOME
The shadowstats site is lean on actual data, requiring a subscription to access what it claims as database.
However, I will make attempt to add in some of the data it presents. This does make assumption that their methodology and counting methods are valid, which I cannot find clear information about.
There also may be comingling of Seasonally Adjusted figures from shadowstats without clarity, but this will be the only series of Tables I post which veer from Not Seasonally Adjusted figures.
The charts they present do show that Unemployment under Trump is better than any time under Obamanomics, so it may be a worthwhile endeavor to investigate.
I will refer to this set of data as Table JSF-URF-5
I will post some actual numbers and let the comparisons and discussion follow. The documented shenanigans of Obamabots deliberately refusing to Report jobless data in the months before the 2012 Election are a different matter, I will just use the Fake Data they produced and pretend it was real.
The 1st column of numbers is the unemployed. The 2nd column is the Rate.
The 3rd column is the sum of the Unemployed plus Marginally Attached plus Involuntary Part-time. 4th column is the Rate for column 3 figure. The Rates in columns 2 and 4 have the denominator of Labor Force.
The 5th column is the Civilian Population. 6th column is Labor Force, 7th column is Participation Rate. 8th column is the published U-6 figure.
The 9th column is the Real Unemployment figure, as presented by shadowstats. The 10th column is the underreported, the difference between the U-6 figure from BLS and the Real figure from shadowstats.
Figures in thousands.
MoYr Unem Pcnt Total Prcnt CivPop LbrForc Prtc% U6% Real Separation
Ja93 09911 07.9 16575 12.8 192644 126034 65.4
Ja94 09492 07.3 16575 12.8 195953 129393 66.0 12% 15.3% 2.3%
Ja95 08101 06.2 14504 11.1 197753 130698 66.1 10% 13.5% 3.5%
Ja96 08270 06.3 14110 10.7 199634 131396 65.8 10.8% 13.5% 2.7%
Ja97 07933 05.9 13886 10.3 202285 134317 66.4 10.4% 13% 2.6%
Ja98 07069 05.2 12638 09.3 204238 135951 66.6 09.3% 12% 2.7%
Ja99 06604 04.8 11607 08.4 206719 137943 66.7 08.5% 11.5% 3.0%
Ja00 06316 04.5 10868 07.8 208782 139621 66.9 07.8% 11% 3.2%
Ja01 06647 04.7 11496 08.2 210889 141049 66.9 08.1% 10.5% 2.4%
Ja02 08935 06.3 14693 10.4 213089 141074 66.2 10.5% 13% 2.5%
Ja02 09051 06.3 15036 10.5 216506 143228 66.2 10.5% 13% 2.5%
Ja03 09395 06.5 15996 11.0 219897 145301 66.1 11.0% 13% 2.0%
Ja04 09144 06.3 15966 10.9 222161 146068 65.7 10.9% 14% 3.1%
Ja05 08444 05.7 15041 10.2 224837 147125 65.4 10.2% 13% 2.8%
Ja06 07608 05.1 13765 09.2 227553 149090 65.5 09.2% 12% 2.8%
Ja07 07649 05.0 13846 09.1 230650 151924 65.9 09.1% 12% 2.9%
Ja08 08221 05.4 15185 09.9 232616 152828 65.7 09.9% 13% 3.1%
Ja09 13009 08.5 23814 15.5 234739 153445 65.4 15.4% 20% 4.6%
Ja10 16147 10.6 27847 18.2 236832 152957 64.6 18.0% 22% 4.0%
Ja11 14937 09.8 26764 17.5 238704 152536 63.9 17.3% 22.5% 5.2%
Ja12 13541 08.8 25097 16.4 242269 153485 63.4 16.2% 22.5% 6.3%
Ja13 13181 08.5 24130 15.6 244663 154794 63.3 15.4% 23% 7.6%
Ja14 10855 07.0 21064 13.6 246915 154381 62.5 13.5% 23.5% 10%
Ja15 09498 06.1 18857 12.1 249723 156050 62.5 12.0% 23.5% 11.5%
Ja16 08309 05.3 16632 10.6 252397 157347 62.3 10.5% 23% 12.5%
Ja17 08149 05.1 16028 10.1 254082 158676 62.5 10.1% 23% 12.9%
Ja18 07189 04.5 14222 08.9 256780 160037 62.3 08.9% 22% 13.1%
Ja19 07140 04.4 14297 08.8 258239 162104 62.8 08.8% 21.8% 13.0%
Ja20 06504 04.0 12573 07.7 259502 163497 63.0 07.7% 21.0% 13.3%
Ja21 10851 06.8 19188 12.1 260851 159234 61.0 12.0% 25.7% 13.7%
Ja22 07207 04.4 12924 07.9 263202 162825 61.9 07.9% 24.5% 16.6%
Ja18 07189 04.5 14222 08.9 2567
NOTIFY: Y | REPLY | REPLY WITH QUOTE | PERMALINK | TOP | HOME
This Table of Data, which breaks down the numerical changes in the key figures.
I will refer to this set of data as Table JSF-URF-6
I will post some actual numbers and let the comparisons and discussion follow.
The BLS uses both Seasonally Adjusted figures and Unadjusted figures, and interchanges them without clearly identifying so. I will use only the Unadjusted numbers, to help maintain clarity and transparency.
Some numbers may have a 0 placed as first digit, to maintain column form in this format.
The 1st column is Labor Force minus both Unemployed and Involuntary Part-Time. This is also Employed minus Involuntary Part-Time. This is not a figure identified by BLS, so I will call it Actually Fully Employed. This is Employed Full-time plus Voluntary Part-Time.
Not listed, but Civilian noninstitutional Population minus Actually Fully Employed is also a figure avoided by BLS, and I will call it Not Fully Employed, which is Unemployed plus Involuntary Part-Time plus Marginally Attached plus Not In Labor Force. The 2nd column is Not Fully Employed Rate, which is divided by Civilian noninstitutional Population.
The 3rd column is the Civilian Population. 4th column is Labor Force, 5th column is Participation Rate.
After the separation bar, the 7th column is the Increase in Civilian Population from the previous entry. For the entries by year, this is the 12 month Increase. For the entries broken down by month, this is the 1 month Increase.
The 8th column is the Increase in Labor Force from the previous entry.
The 9th column is the Increase in Actually Fully Employed count, from the previous entry.
In the monthly breakdown for 2018, after the second separation bar, the 10th column is the Civilian Population Increase from the entry 12 months prior.
The 11th column is the Labor Force Increase from the entry 12 months prior.
The 12th column is the Actually Fully Employed Increase from the entry 12 months prior.
The 13th column is the amount that the 12th column exceeds the 10th column, or the amount of Unemployed that is being chipped away, despite manipulation of other figures.
Figures in thousands.
Mo/Yr AcEmpl NtEm CiviPop LbrFrc Prtc% | CPIn LFIn AEInc
Jan94 114938 41.3% 195953 129393 66.0% |
Jan95 117923 40.4% 197753 130698 66.1% | 1800 1305 02985/+1185
Jan96 119023 40.4% 199634 131396 65.8% | 1881 0698 01100/-0781
Jan97 122046 39.7% 202285 134317 66.4% | 2651 2921 03023/+0372
Jan98 124798 38.9% 204238 135951 66.6% | 1953 1634 02752/+0799
Jan99 127694 38.2% 206719 137943 66.7% | 2481 1992 02896/+0415
Jan00 129950 37.8% 208782 139621 66.9% | 2063 1678 02256/+0193
Jan01 130843 38.0% 210889 141049 66.9% | 2107 1428 00893/-1214
Jan02 127890 40.0% 213089 141074 66.2% | 2200 0025 -2953/-5153
Jan02 129724 40.1% 216506 143228 66.2% | 5617 2179 -1119/-6736
Jan03 130903 40.5% 219897 145301 66.1% | 3391 2073 01179/-2212
Jan04 131772 40.7% 222161 146068 65.7% | 2264 0767 00869/-1395
Jan05 133888 40.5% 224837 147125 65.4% | 2676 1057 02116/-0560
Jan06 136978 39.8% 227553 149090 65.5% | 2716 1965 03090/+0374
Jan07 139655 39.5% 230650 151924 65.9% | 3097 2834 02677/-0420
Jan08 139372 40.1% 232616 152828 65.7% | 1966 0904 -0283/-2249
Jan09 131761 43.9% 234739 153445 65.4% | 2123 0617 -7611/-9734
Jan10 127649 46.1% 236832 152957 64.6% | 2093 -488 -4112/-6205
Jan11 128572 46.1% 238704 152536 63.9% | 1872 -421 00923/-0949
Jan12 131197 45.8% 242269 153485 63.4% | 3565 0949 02625/-0940
Jan13 133107 45.6% 244663 154794 63.3% | 2394 1309 01910/-0484
Jan14 135909 45.0% 246915 154381 62.5% | 2252 -413 02802/+0550
Jan15 139427 44.2% 249723 156050 62.5% | 2808 1669 03518/+0710
Jan16 1428
NOTIFY: Y | REPLY | REPLY WITH QUOTE | PERMALINK | TOP | HOME
Quote:
Originally posted by captaincrunch:
https://www.factcheck.org/2022/01/bidens-numbers/
Unlike MSM or any source with paid sponsors, they don't flinch when it comes rating Biden/presidents up or down. The part where people stumble (or lie to suit their own desires) is in attributing the "why" to any of these moves.
Quoting for hilarity.
The Ministry of Truth Lemmings are gloating about Lord Darth Obidens skyrocketing numbers.
Check out Border Crossing "Apprehensions" aka Criminal Illegal Unvaxxed Invaders, which they then bus or Fly In The Middle Of The Night to non-Border States.
Consumer Price Index aka INFLATION.
Murders.
Federal Debt.
Trade Deficit.
Yay.
And that was only the disaster up to Jan 19, not including since. Much of that time was coasting along on the coattails of Trump's massive successes.
NOTIFY: Y | REPLY | REPLY WITH QUOTE | PERMALINK | TOP | HOME
It makes you wonder why they bother.
The only idiots who believe factcheck.org are the idiots who were going to vote the way that factcheck.org wanted them to.
--------------------------------------------------
Me: "Remember Covid?"
Useless Idiots: "What's Covid, durr? Russia, Ukraine, Putin, NATO *drool*. DURRRR!!!!"
NOTIFY: Y | REPLY | REPLY WITH QUOTE | PERMALINK | TOP | HOME
Quote:
Originally posted by JEWELSTAITEFAN:
Check out Border Crossing "Apprehensions" aka Criminal Illegal Unvaxxed Invaders, which they then bus or Fly In The Middle Of The Night to non-Border States.
Consumer Price Index aka INFLATION.
Murders.
Federal Debt.
Trade Deficit.
Yay.
And that was only the disaster up to Jan 19, not including since. Much of that time was coasting along on the coattails of Trump's massive successes.
Thanks for proving me right: "The part where people stumble (or lie to suit their own desires) is in attributing the "why" to any of these moves."
I don't suppose you went to the linky and read how they broke each of those down? You just assumed it was all Libtard drooling?
If you had you would have seen a detailed analysis of each item. For instance, when it comes to "Border Crossing "Apprehensions." I saw that number and assumed (rightfully) that it was true but needed further examination. And they go into that in detail and describe the same thing I had guessed. Specifically, more people tried to come across illegally after Biden got into office than under Trump because they though Biden was softer on illegal immigration. More people leads to more apprehensions. It's really a negative if you read their analysis. There's more but you're probably too busy.
"Border Security
A key measurement of illegal immigration rose dramatically under Biden.
The number of apprehensions at the U.S. border with Mexico increased 317% during Biden’s first full 10 months in office, compared with the same period in 2020, according to the most recent figures released by U.S. Customs and Border Protection.
Illegal border crossings, as measured by apprehensions at the Southwest border, were rising steadily in the last nine months of Trump’s presidency, and then surged dramatically after Biden took office.
From January to March of last year, the number of apprehensions more than doubled to 169,216. They continued to rise, hitting a peak of just over 200,000 in July (a monthly figure that hadn’t been seen since 2000). The monthly numbers have come down a bit since then, and were at 165,783 in November. But that’s still nearly two and a half times the number from the previous November.
Jessica Bolter, an associate policy analyst at the Migration Policy Institute, said the figures come with an important caveat. The numbers represent the total number of apprehensions, so if someone is encountered attempting to cross the border multiple times in a month or year, each is recorded separately. And there is reason to believe those repeat cases are much higher than in years prior to fiscal year 2020.
Most of the apprehensions at the border have been illegal border crossings that resulted in immediate expulsions under Title 42, a public health law the Trump administration began invoking at the Southwest border in March 2020 due to the coronavirus pandemic.
“It had a counter-intuitive effect on the migration patterns of single adults,” Bolter said. “It lessened the consequences of being caught crossing the border.”
Instead of being detained for a longer period of time, being criminally prosecuted or having a formal removal order placed on your record, those subject to Title 42 are simply turned around at the border. As a result, Bolter said, it encouraged people to simply try crossing again and again, driving up the apprehension numbers.
According to U.S. Customs and Border Protection, the recidivism rate — meaning the share of people caught crossing more than once — was 27% in fiscal year 2021, which began under Trump on Oct. 1, 2020, and ended on Sept. 30, 2021, when Biden was president. By comparison, the rate was just 7% in fiscal year 2019. (Given that the Title 42 policy was enacted in March 2020, the fiscal year 2020 recidivism rate under Trump was similarly high, 26%.)
That being said, the surging numbers of apprehensions “is not all an illusion,” Bolter said. “There has been an in
NOTIFY: Y | REPLY | REPLY WITH QUOTE | PERMALINK | TOP | HOME
lol
He didn't prove you right.
Who checks the "fact" checkers? Mayorkas?
Get fucked, Cap'n.
--------------------------------------------------
Me: "Remember Covid?"
Useless Idiots: "What's Covid, durr? Russia, Ukraine, Putin, NATO *drool*. DURRRR!!!!"
NOTIFY: Y | REPLY | REPLY WITH QUOTE | PERMALINK | TOP | HOME
Quote:
Originally posted by captaincrunch:Quote:Thanks for proving me right: "The part where people stumble (or lie to suit their own desires) is in attributing the "why" to any of these moves."
Originally posted by JEWELSTAITEFAN:
Check out Border Crossing "Apprehensions" aka Criminal Illegal Unvaxxed Invaders, which they then bus or Fly In The Middle Of The Night to non-Border States.
Consumer Price Index aka INFLATION.
Murders.
Federal Debt.
Trade Deficit.
Yay.
And that was only the disaster up to Jan 19, not including since. Much of that time was coasting along on the coattails of Trump's massive successes.
I don't suppose you went to the linky and read how they broke each of those down? You just assumed it was all Libtard drooling?
If you had you would have seen a detailed analysis of each item. For instance, when it comes to "Border Crossing "Apprehensions." I saw that number and assumed (rightfully) that it was true but needed further examination. And they go into that in detail and describe the same thing I had guessed. Specifically, more people tried to come across illegally after Biden got into office than under Trump because they though Biden was softer on illegal immigration. More people leads to more apprehensions. It's really a negative if you read their analysis. There's more but you're probably too busy.
"Border Security
A key measurement of illegal immigration rose dramatically under Biden.
The number of apprehensions at the U.S. border with Mexico increased 317% during Biden’s first full 10 months in office, compared with the same period in 2020, according to the most recent figures released by U.S. Customs and Border Protection.
Illegal border crossings, as measured by apprehensions at the Southwest border, were rising steadily in the last nine months of Trump’s presidency, and then surged dramatically after Biden took office.
From January to March of last year, the number of apprehensions more than doubled to 169,216. They continued to rise, hitting a peak of just over 200,000 in July (a monthly figure that hadn’t been seen since 2000). The monthly numbers have come down a bit since then, and were at 165,783 in November. But that’s still nearly two and a half times the number from the previous November.
Jessica Bolter, an associate policy analyst at the Migration Policy Institute, said the figures come with an important caveat. The numbers represent the total number of apprehensions, so if someone is encountered attempting to cross the border multiple times in a month or year, each is recorded separately. And there is reason to believe those repeat cases are much higher than in years prior to fiscal year 2020.
Most of the apprehensions at the border have been illegal border crossings that resulted in immediate expulsions under Title 42, a public health law the Trump administration began invoking at the Southwest border in March 2020 due to the coronavirus pandemic.
“It had a counter-intuitive effect on the migration patterns of single adults,” Bolter said. “It lessened the consequences of being caught crossing the border.”
Instead of being detained for a longer period of time, being criminally prosecuted or having a formal removal order placed on your record, those subject to Title 42 are simply turned around at the border. As a result, Bolter said, it encouraged people to simply try crossing again and again, driving up the apprehension numbers.
According to U.S. Customs and Border Protection, the recidivism rate — meaning the share of people caught crossing more than once — was 27% in fiscal year 2021, which began under Trump on Oct. 1, 2020, and ended on Sept. 30, 2021, when Biden was president. By comparison, the rate was just 7% in fiscal year 2019. (Given that the Title 42 policy was enacted in March 2020, the fiscal year 2020 recidivism rate under Trump was similarly high, 26%.)
That being said, the surging numbers of apprehensions “is not all an illu
NOTIFY: Y | REPLY | REPLY WITH QUOTE | PERMALINK | TOP | HOME
Updating with Jobs Report data from today:
I will refer to this set of data as Table JSF-URF-1
Jan 2002 is listed twice. First with original report data from February 2002. Second with revised data from new Census data, published in February 2003.
Quote:
Originally posted by JEWELSTAITEFAN:
BLS currently defines the Want A Job category as not being part of the Labor Force.
So I will post some actual numbers and let the comparisons and discussion follow. The documented shenanigans of Obamabots deliberately refusing to Report jobless data in the months before the 2012 Election are a different matter, I will just use the Fake Data they produced and pretend it was real.
I will use only the Unadjusted numbers, to help maintain clarity and transparency.
Mo/Yr Unemp Pcnt WAJb Pcnt SubTtl Pcnt InvPT Pcnt Total Prcnt CivPop LbrFrc Prtc% U-6
Jan98 07069 05.2% 5026 3.7% 12095 08.9% 4090 3.0% 16185 11.9% 204238 135951 66.6 09.3
Jan99 06604 04.8% 4800 3.5% 11404 08.3% 3645 2.6% 15049 10.9% 206719 137943 66.7 08.5
Jan00 06316 04.5% 4354 3.1% 10670 07.6% 3355 2.4% 14025 10.0% 208782 139621 66.9 07.8
Jan01 06647 04.7% 4474 3.2% 11121 07.9% 3559 2.5% 14680 10.4% 210889 141049 66.9 08.1
Jan02 08935 06.3% 4872 3.5% 13807 09.8% 4249 3.0% 18056 12.8% 213089 141074 66.2 10.5
Jan02 09051 06.3% 4938 3.4% 13989 09.8% 4453 3.1% 18442 12.9% 216506 143228 66.2 10.5
Jan03 09395 06.5% 4779 3.3% 14174 09.8% 5003 3.4% 19177 13.2% 219897 145301 66.1 11.0
Jan04 09144 06.3% 4913 3.4% 14057 09.6% 5152 3.5% 19209 13.2% 222161 146068 65.7 10.9
Jan05 08444 05.7% 5136 3.5% 13580 09.2% 4793 3.3% 18373 12.5% 224837 147125 65.4 10.2
Jan06 07608 05.1% 5095 3.4% 12703 08.5% 4513 3.0% 17216 11.5% 227553 149090 65.5 09.2
Jan07 07649 05.0% 4633 3.0% 12282 08.1% 4620 3.0% 16902 11.1% 230650 151924 65.9 09.1
Jan08 08221 05.4% 4977 3.2% 13198 08.6% 5235 3.5% 18433 12.1% 232616 152828 65.7 09.9
Jan09 13009 08.5% 5866 3.8% 18875 12.3% 8675 5.7% 27550 18.0% 234739 153445 65.4 15.4
Jan10 16147 10.6% 6108 4.0% 22255 14.6% 9161 5.9% 31416 20.5% 236832 152957 64.6 18.0
Jan11 14937 09.8% 6643 4.3% 21580 14.1% 9027 6.0% 30607 20.1% 238704 152536 63.9 17.3
Jan12 13541 08.8% 6495 4.3% 20036 13.1% 8747 5.7% 28783 18.8% 242269 153485 63.4 16.2
Jan13 13181 08.5% 6781 4.4% 19962 12.9% 8506 5.5% 28468 18.4% 244663 154794 63.3 15.4
Jan14 10855 07.0% 6508 4.2% 17363 11.2% 7617 5.0% 24980 16.2% 246915 154381 62.5 13.5
Jan15 09498 06.1% 6467 4.1% 15965 10.2% 7125 4.6% 23090 14.8% 249723 156050 62.5 12.0
Jan16 08309 05.3% 6166 3.9% 14475 09.2% 6234 4.0% 20709 13.2% 252397 157347 62.3 10.5
Jan17 08149 05.1% 5934 3.8% 14083 08.9% 6127 3.8% 20210 12.7% 254082 158676 62.5 10.1
Jan18 07189 04.5% 5364 3.3% 12553 07.8% 5380 3.4% 17933 11.2% 256780 160037 62.3 08.9
Jan19 07140 04.4% 5435 3.4% 12575 07.8% 5543 3.4% 18118 11.2% 258239 162104 62.8 08.8
Jan20 06504 04.0% 5107 3.1% 11611 07.1% 4605 2.8% 16216 09.9% 259502 163497 63.0 07.7
Jan21 10851 06.8% 7129 4.5% 17980 11.3% 6284 3.9% 24264 15.2% 260851 159234 61.0 12.0
Jan22 07207 04.4% 5872 3.6% 13079 08.0%
NOTIFY: Y | REPLY | REPLY WITH QUOTE | PERMALINK | TOP | HOME
Updating with today's Jobs Report to this Table of Data, which seems to best show the components of U6:
I will refer to this set of data as Table JSF-URF-2
Note: this year the Marginally Attached data is in Table A-16 of the report.
Quote:
I will post some actual numbers and let the comparisons and discussion follow. The documented shenanigans of Obamabots deliberately refusing to Report jobless data in the months before the 2012 Election are a different matter, I will just use the Fake Data they produced and pretend it was real.
The BLS uses both Seasonally Adjusted figures and Unadjusted figures, and interchanges them without clearly identifying so. For example, the current Rate of 4.1% (for 4 months straight) is SeasAdj, and the real Rate is 4.5% for Jan 2018. I will use only the Unadjusted numbers, to help maintain clarity and transparency.
Some numbers may have a 0 placed as first digit, to maintain column form in this format.
The 1st column of numbers is the unemployed. The 2nd column is the Rate.
The 3rd column is what is called Marginally Attached to the Labor Force, which is included in the Want A Job Now category but NOT included in the Labor Force category and therefore excluded from the reported Unemployment category. The 5th column is the sum of Unemployed plus Marginally Attached - which more accurately represents the Actual Unemployed. The 6th column is the Rate for column 5 figure.
The 7th column is the Involuntary Part-Time workers, who are Not Employed Full Time due to poor Economy, and want, are able to work FT. The 8th column is the Rate for column 7. The 9th column is the sum of the 5th column plus 7th column. 10th column is the Rate for column 9 figure. The Rates in columns 2, 4, 6, 8, 10 have the denominator of Labor Force.
The 11th column is the Civilian Population. 12th column is Labor Force, 13th column is Participation Rate. 14th column is the published U-6 figure.
Figures in thousands.
MoYr Unemp Pct MrgAt Pct SbTtl Pct InvPT Pct Total Pcnt CivPop LbrFrc Prtc% U6%
Ja93 09911 07.9 2120 1.6 11612 09.0 6181 4.9 16575 12.8 192644 126034 65.4
Ja94 09492 07.3 2120 1.6 11612 09.0 4963 3.8 16575 12.8 195953 129393 66.0
Ja95 08101 06.2 1783 1.4 09884 07.6 4620 3.5 14504 11.1 197753 130698 66.1
Ja96 08270 06.3 1737 1.3 10007 07.6 4103 3.1 14110 10.7 199634 131396 65.8 10.8
Ja97 07933 05.9 1615 1.2 09548 07.1 4338 3.2 13886 10.3 202285 134317 66.4 10.4
Ja98 07069 05.2 1479 1.1 08548 06.3 4090 3.0 12638 09.3 204238 135951 66.6 09.3
Ja99 06604 04.8 1358 1.0 07962 05.8 3645 2.6 11607 08.4 206719 137943 66.7 08.5
Ja00 06316 04.5 1197 0.9 07513 05.4 3355 2.4 10868 07.8 208782 139621 66.9 07.8
Ja01 06647 04.7 1290 0.9 07937 05.6 3559 2.5 11496 08.2 210889 141049 66.9 08.1
Ja02 08935 06.3 1509 1.1 10444 07.4 4249 3.0 14693 10.4 213089 141074 66.2 10.5
Ja02 09051 06.3 1532 1.1 10583 07.4 4453 3.1 15036 10.5 216506 143228 66.2 10.5
Ja03 09395 06.5 1598 1.1 10993 07.6 5003 3.4 15996 11.0 219897 145301 66.1 11.0
Ja04 09144 06.3 1670 1.1 10814 07.4 5152 3.5 15966 10.9 222161 146068 65.7 10.9
Ja05 08444 05.7 1804 1.2 10248 07.0 4793 3.3 15041 10.2 224837 147125 65.4 10.2
Ja06 07608 05.1 1644 1.1 09252 06.2 4513 3.0 13765 09.2 227553 149090 65.5 09.2
Ja07 07649 05.0 1577 1.0 09226 06.1 4620 3.0 13846 09.1 230650 151924 65.9 09.1
Ja08 08221 05.4 1729 1.1 09950 06.5 5235 3.4 15185 09.9 232616 152828 65.7 09.9
Ja09 13009 08.5 2130 1.4 15139 09.9 8675 5.6 23814 15.5 234739 153445 65.4 15.4
Ja10 16147 10.6 2539 1.6 18686 12.2 9161 6.0 27847 18.2 236832 152957 64.6 18.0
Ja11 14937 09.8 2800 1.8 17737 11.6 9027 5.9 26764 17.5 238704 152536 63.9 17.3
Ja12 13541 08.8 2809 1.9 16350 10.7 8747 5.7 25097 16.4 242269 153485 63.4 16.2
Ja13 13181 08.5 2443 1.6 15624 10.1 8506 5.5 24130 15.6 244663 154794 63.3 15.4
Ja14 10855 07.0 2592 1.7 13447 08.7 7617 4.9 2
NOTIFY: Y | REPLY | REPLY WITH QUOTE | PERMALINK | TOP | HOME
This Table of Data, which includes Not Fully Employed Rate.
I will refer to this set of data as Table JSF-URF-3
I will post some actual numbers and let the comparisons and discussion follow.
The BLS uses both Seasonally Adjusted figures and Unadjusted figures, and interchanges them without clearly identifying so. I will use only the Unadjusted numbers, to help maintain clarity and transparency.
Some numbers may have a 0 placed as first digit, to maintain column form in this format.
The 1st column of numbers is the Unemployed.
The 2nd column is what is called Marginally Attached to the Labor Force, which is included in the Want A Job Now category but NOT included in the Labor Force category and therefore excluded from the reported Unemployment category.
The 3rd column is the Involuntary Part-Time workers, who are Not Employed Full Time due to poor Economy, and want, are able to work FT. The 4th column of numbers is the sum of the 1st, 2nd, and 3rd columns. 5th column is the Rate for column 4 figure, divided by Labor Force.
The 6th column of numbers is the Subtotal of columns 1 and 3, Unemployed plus Involuntary Part-Time.
The 7th column is Labor Force minus column 6. This is also Employed minus column 3 Involuntary Part-Time. This is not a figure identified by BLS, so I will call it Actually Fully Employed. This is Employed Full-time plus Voluntary Part-Time.
Not listed, but Civilian noninstitutional Population minus Actually Fully Employed is also a figure avoided by BLS, and I will call it Not Fully Employed, which is Unemployed plus Involuntary Part-Time plus Marginally Attached plus Not In Labor Force. The 8th column is Not Fully Employed Rate, which is divided by Civilian noninstitutional Population.
The 9th column is the Civilian Population. 10th column is Labor Force, 11th column is Participation Rate. 12th column is the published U-6 figure.
Figures in thousands.
Mo/Yr Unem MrgAt InvPT Totl Prct SbTtl AcEmpl NotEm CivPop LbrForc Prtc% U6%
Jan94 09492 2120 4963 16575 12.8 14455 114938 41.3% 195953 129393 66.0
Jan95 08101 1783 4620 14504 11.1 12721 117923 40.4% 197753 130698 66.1
Jan96 08270 1737 4103 14110 10.7 12373 119023 40.4% 199634 131396 65.8 10.8
Jan97 07933 1615 4338 13886 10.3 12271 122046 39.7% 202285 134317 66.4 10.4
Jan98 07069 1479 4090 12638 09.3 11159 124798 38.9% 204238 135951 66.6 09.3
Jan99 06604 1358 3645 11607 08.4 10249 127694 38.2% 206719 137943 66.7 08.5
Jan00 06316 1197 3355 10868 07.8 09671 129950 37.8% 208782 139621 66.9 07.8
Jan01 06647 1290 3559 11496 08.2 10206 130843 38.0% 210889 141049 66.9 08.1
Jan02 08935 1509 4249 14693 10.4 13184 127890 40.0% 213089 141074 66.2 10.5
Jan02 09051 1532 4453 15036 10.5 13504 129724 40.1% 216506 143228 66.2 10.5
Jan03 09395 1598 5003 15996 11.0 14398 130903 40.5% 219897 145301 66.1 11.0
Jan04 09144 1670 5152 15966 10.9 14296 131772 40.7% 222161 146068 65.7 10.9
Jan05 08444 1804 4793 15041 10.2 13237 133888 40.5% 224837 147125 65.4 10.2
Jan06 07608 1644 4513 13765 09.2 12122 136978 39.8% 227553 149090 65.5 09.2
Jan07 07649 1577 4620 13846 09.1 12269 139655 39.5% 230650 151924 65.9 09.1
Jan08 08221 1729 5235 15185 09.9 13456 139372 40.1% 232616 152828 65.7 09.9
Jan09 13009 2130 8675 23814 15.5 21684 131761 43.9% 234739 153445 65.4 15.4
Jan10 16147 2539 9161 27847 18.2 25308 127649 46.1% 236832 152957 64.6 18.0
Jan11 14937 2800 9027 26764 17.5 23964 128572 46.1% 238704 152536 63.9 17.3
Jan12 13541 2809 8747 25097 16.4 22288 131197 45.8% 242269 153485 63.4 16.2
Jan13 13181 2443 8506 24130 15.6 21687 133107 45.6% 244663 154794 63.3 15.4
Jan14 10855 2592 7617 21064 13.6 18472 135909 45.0% 246915 154381 62.5 13.5
Jan15 09498 2234 7125 1885
NOTIFY: Y | REPLY | REPLY WITH QUOTE | PERMALINK | TOP | HOME
Quote:
Originally posted by JEWELSTAITEFAN:
The shadowstats site is lean on actual data, requiring a subscription to access what it claims as database.
However, I will make attempt to add in some of the data it presents. This does make assumption that their methodology and counting methods are valid, which I cannot find clear information about.
There also may be comingling of Seasonally Adjusted figures from shadowstats without clarity, but this will be the only series of Tables I post which veer from Not Seasonally Adjusted figures.
The charts they present do show that Unemployment under Trump is better than any time under Obamanomics, so it may be a worthwhile endeavor to investigate.
I will refer to this set of data as Table JSF-URF-5
I will post some actual numbers and let the comparisons and discussion follow. The documented shenanigans of Obamabots deliberately refusing to Report jobless data in the months before the 2012 Election are a different matter, I will just use the Fake Data they produced and pretend it was real.
The 1st column of numbers is the unemployed. The 2nd column is the Rate.
The 3rd column is the sum of the Unemployed plus Marginally Attached plus Involuntary Part-time. 4th column is the Rate for column 3 figure. The Rates in columns 2 and 4 have the denominator of Labor Force.
The 5th column is the Civilian Population. 6th column is Labor Force, 7th column is Participation Rate. 8th column is the published U-6 figure.
The 9th column is the Real Unemployment figure, as presented by shadowstats. The 10th column is the underreported, the difference between the U-6 figure from BLS and the Real figure from shadowstats.
Figures in thousands.
MoYr Unem Pcnt Total Prcnt CivPop LbrForc Prtc% U6% Real Separation
Ja93 09911 07.9 16575 12.8 192644 126034 65.4
Ja94 09492 07.3 16575 12.8 195953 129393 66.0 12% 15.3% 2.3%
Ja95 08101 06.2 14504 11.1 197753 130698 66.1 10% 13.5% 3.5%
Ja96 08270 06.3 14110 10.7 199634 131396 65.8 10.8% 13.5% 2.7%
Ja97 07933 05.9 13886 10.3 202285 134317 66.4 10.4% 13% 2.6%
Ja98 07069 05.2 12638 09.3 204238 135951 66.6 09.3% 12% 2.7%
Ja99 06604 04.8 11607 08.4 206719 137943 66.7 08.5% 11.5% 3.0%
Ja00 06316 04.5 10868 07.8 208782 139621 66.9 07.8% 11% 3.2%
Ja01 06647 04.7 11496 08.2 210889 141049 66.9 08.1% 10.5% 2.4%
Ja02 08935 06.3 14693 10.4 213089 141074 66.2 10.5% 13% 2.5%
Ja02 09051 06.3 15036 10.5 216506 143228 66.2 10.5% 13% 2.5%
Ja03 09395 06.5 15996 11.0 219897 145301 66.1 11.0% 13% 2.0%
Ja04 09144 06.3 15966 10.9 222161 146068 65.7 10.9% 14% 3.1%
Ja05 08444 05.7 15041 10.2 224837 147125 65.4 10.2% 13% 2.8%
Ja06 07608 05.1 13765 09.2 227553 149090 65.5 09.2% 12% 2.8%
Ja07 07649 05.0 13846 09.1 230650 151924 65.9 09.1% 12% 2.9%
Ja08 08221 05.4 15185 09.9 232616 152828 65.7 09.9% 13% 3.1%
Ja09 13009 08.5 23814 15.5 234739 153445 65.4 15.4% 20% 4.6%
Ja10 16147 10.6 27847 18.2 236832 152957 64.6 18.0% 22% 4.0%
Ja11 14937 09.8 26764 17.5 238704 152536 63.9 17.3% 22.5% 5.2%
Ja12 13541 08.8 25097 16.4 242269 153485 63.4 16.2% 22.5% 6.3%
Ja13 13181 08.5 24130 15.6 244663 154794 63.3 15.4% 23% 7.6%
Ja14 10855 07.0 21064 13.6 246915 154381 62.5 13.5% 23.5% 10%
Ja15 09498 06.1 18857 12.1 249723 156050 62.5 12.0% 23.5% 11.5%
Ja16 08309 05.3 16632 10.6 252397 157347 62.3 10.5% 23% 12.5%
Ja17 08149 05.1 16028 10.1 254082 158676 62.5 10.1% 23% 12.9%
Ja18 07189 04.5 14222 08.9 256780 160037 62.3 08.9% 22% 13.1%
Ja19 07140 04.4 14297 08.8 258239 162104 62.8 08.8% 21.8% 13.0%
Ja20 06504 04.0 12573 07.7 259502 163497 63.0 07.7% 21.0% 13.3%
Ja21 10851 06.8 19188 12.1 260851 159234 61.0 12.0% 25.7% 13.7%
Ja22 07207 04.4 12924 07.9 263202 162825 61.9 07.9% 24.5
NOTIFY: Y | REPLY | REPLY WITH QUOTE | PERMALINK | TOP | HOME
This Table of Data, which breaks down the numerical changes in the key figures.
I will refer to this set of data as Table JSF-URF-6
I will post some actual numbers and let the comparisons and discussion follow.
The BLS uses both Seasonally Adjusted figures and Unadjusted figures, and interchanges them without clearly identifying so. I will use only the Unadjusted numbers, to help maintain clarity and transparency.
Some numbers may have a 0 placed as first digit, to maintain column form in this format.
The 1st column is Labor Force minus both Unemployed and Involuntary Part-Time. This is also Employed minus Involuntary Part-Time. This is not a figure identified by BLS, so I will call it Actually Fully Employed. This is Employed Full-time plus Voluntary Part-Time.
Not listed, but Civilian noninstitutional Population minus Actually Fully Employed is also a figure avoided by BLS, and I will call it Not Fully Employed, which is Unemployed plus Involuntary Part-Time plus Marginally Attached plus Not In Labor Force. The 2nd column is Not Fully Employed Rate, which is divided by Civilian noninstitutional Population.
The 3rd column is the Civilian Population. 4th column is Labor Force, 5th column is Participation Rate.
After the separation bar, the 7th column is the Increase in Civilian Population from the previous entry. For the entries by year, this is the 12 month Increase. For the entries broken down by month, this is the 1 month Increase.
The 8th column is the Increase in Labor Force from the previous entry.
The 9th column is the Increase in Actually Fully Employed count, from the previous entry.
In the monthly breakdown for 2018, after the second separation bar, the 10th column is the Civilian Population Increase from the entry 12 months prior.
The 11th column is the Labor Force Increase from the entry 12 months prior.
The 12th column is the Actually Fully Employed Increase from the entry 12 months prior.
The 13th column is the amount that the 12th column exceeds the 10th column, or the amount of Unemployed that is being chipped away, despite manipulation of other figures.
Figures in thousands.
Mo/Yr AcEmpl NtEm CiviPop LbrFrc Prtc% | CPIn LFIn AEInc
Jan94 114938 41.3% 195953 129393 66.0% |
Jan95 117923 40.4% 197753 130698 66.1% | 1800 1305 02985/+1185
Jan96 119023 40.4% 199634 131396 65.8% | 1881 0698 01100/-0781
Jan97 122046 39.7% 202285 134317 66.4% | 2651 2921 03023/+0372
Jan98 124798 38.9% 204238 135951 66.6% | 1953 1634 02752/+0799
Jan99 127694 38.2% 206719 137943 66.7% | 2481 1992 02896/+0415
Jan00 129950 37.8% 208782 139621 66.9% | 2063 1678 02256/+0193
Jan01 130843 38.0% 210889 141049 66.9% | 2107 1428 00893/-1214
Jan02 127890 40.0% 213089 141074 66.2% | 2200 0025 -2953/-5153
Jan02 129724 40.1% 216506 143228 66.2% | 5617 2179 -1119/-6736
Jan03 130903 40.5% 219897 145301 66.1% | 3391 2073 01179/-2212
Jan04 131772 40.7% 222161 146068 65.7% | 2264 0767 00869/-1395
Jan05 133888 40.5% 224837 147125 65.4% | 2676 1057 02116/-0560
Jan06 136978 39.8% 227553 149090 65.5% | 2716 1965 03090/+0374
Jan07 139655 39.5% 230650 151924 65.9% | 3097 2834 02677/-0420
Jan08 139372 40.1% 232616 152828 65.7% | 1966 0904 -0283/-2249
Jan09 131761 43.9% 234739 153445 65.4% | 2123 0617 -7611/-9734
Jan10 127649 46.1% 236832 152957 64.6% | 2093 -488 -4112/-6205
Jan11 128572 46.1% 238704 152536 63.9% | 1872 -421 00923/-0949
Jan12 131197 45.8% 242269 153485 63.4% | 3565 0949 02625/-0940
Jan13 133107 45.6% 244663 154794 63.3% | 2394 1309 01910/-0484
Jan14 135909 45.0% 246915 154381 62.5% | 2252 -413 02802/+0550
Jan15 139427 44.2% 249723 156050 62.5% | 2808 1669 03518/+0710
Jan16 1428
NOTIFY: Y | REPLY | REPLY WITH QUOTE | PERMALINK | TOP | HOME
Updating with Jobs Report data from today:
I will refer to this set of data as Table JSF-URF-1
Jan 2002 is listed twice. First with original report data from February 2002. Second with revised data from new Census data, published in February 2003.
Quote:
Originally posted by JEWELSTAITEFAN:
BLS currently defines the Want A Job category as not being part of the Labor Force.
So I will post some actual numbers and let the comparisons and discussion follow. The documented shenanigans of Obamabots deliberately refusing to Report jobless data in the months before the 2012 Election are a different matter, I will just use the Fake Data they produced and pretend it was real.
I will use only the Unadjusted numbers, to help maintain clarity and transparency.
Mo/Yr Unemp Pcnt WAJb Pcnt SubTtl Pcnt InvPT Pcnt Total Prcnt CivPop LbrFrc Prtc% U-6
Jan98 07069 05.2% 5026 3.7% 12095 08.9% 4090 3.0% 16185 11.9% 204238 135951 66.6 09.3
Jan99 06604 04.8% 4800 3.5% 11404 08.3% 3645 2.6% 15049 10.9% 206719 137943 66.7 08.5
Jan00 06316 04.5% 4354 3.1% 10670 07.6% 3355 2.4% 14025 10.0% 208782 139621 66.9 07.8
Jan01 06647 04.7% 4474 3.2% 11121 07.9% 3559 2.5% 14680 10.4% 210889 141049 66.9 08.1
Jan02 08935 06.3% 4872 3.5% 13807 09.8% 4249 3.0% 18056 12.8% 213089 141074 66.2 10.5
Jan02 09051 06.3% 4938 3.4% 13989 09.8% 4453 3.1% 18442 12.9% 216506 143228 66.2 10.5
Jan03 09395 06.5% 4779 3.3% 14174 09.8% 5003 3.4% 19177 13.2% 219897 145301 66.1 11.0
Jan04 09144 06.3% 4913 3.4% 14057 09.6% 5152 3.5% 19209 13.2% 222161 146068 65.7 10.9
Jan05 08444 05.7% 5136 3.5% 13580 09.2% 4793 3.3% 18373 12.5% 224837 147125 65.4 10.2
Jan06 07608 05.1% 5095 3.4% 12703 08.5% 4513 3.0% 17216 11.5% 227553 149090 65.5 09.2
Jan07 07649 05.0% 4633 3.0% 12282 08.1% 4620 3.0% 16902 11.1% 230650 151924 65.9 09.1
Jan08 08221 05.4% 4977 3.2% 13198 08.6% 5235 3.5% 18433 12.1% 232616 152828 65.7 09.9
Jan09 13009 08.5% 5866 3.8% 18875 12.3% 8675 5.7% 27550 18.0% 234739 153445 65.4 15.4
Jan10 16147 10.6% 6108 4.0% 22255 14.6% 9161 5.9% 31416 20.5% 236832 152957 64.6 18.0
Jan11 14937 09.8% 6643 4.3% 21580 14.1% 9027 6.0% 30607 20.1% 238704 152536 63.9 17.3
Jan12 13541 08.8% 6495 4.3% 20036 13.1% 8747 5.7% 28783 18.8% 242269 153485 63.4 16.2
Jan13 13181 08.5% 6781 4.4% 19962 12.9% 8506 5.5% 28468 18.4% 244663 154794 63.3 15.4
Jan14 10855 07.0% 6508 4.2% 17363 11.2% 7617 5.0% 24980 16.2% 246915 154381 62.5 13.5
Jan15 09498 06.1% 6467 4.1% 15965 10.2% 7125 4.6% 23090 14.8% 249723 156050 62.5 12.0
Jan16 08309 05.3% 6166 3.9% 14475 09.2% 6234 4.0% 20709 13.2% 252397 157347 62.3 10.5
Jan17 08149 05.1% 5934 3.8% 14083 08.9% 6127 3.8% 20210 12.7% 254082 158676 62.5 10.1
Jan18 07189 04.5% 5364 3.3% 12553 07.8% 5380 3.4% 17933 11.2% 256780 160037 62.3 08.9
Jan19 07140 04.4% 5435 3.4% 12575 07.8% 5543 3.4% 18118 11.2% 258239 162104 62.8 08.8
Jan20 06504 04.0% 5107 3.1% 11611 07.1% 4605 2.8% 16216 09.9% 259502 163497 63.0 07.7
Jan21 10851 06.8% 7129 4.5% 17980 11.3% 6284 3.9% 24264 15.2% 260851 159234 61.0 12.0
Jan22 07207 04.4% 5872 3.6% 13079 08.0%
NOTIFY: Y | REPLY | REPLY WITH QUOTE | PERMALINK | TOP | HOME
Updating with today's Jobs Report to this Table of Data, which seems to best show the components of U6:
I will refer to this set of data as Table JSF-URF-2
Note: this year the Marginally Attached data is in Table A-16 of the report.
Quote:
I will post some actual numbers and let the comparisons and discussion follow. The documented shenanigans of Obamabots deliberately refusing to Report jobless data in the months before the 2012 Election are a different matter, I will just use the Fake Data they produced and pretend it was real.
The BLS uses both Seasonally Adjusted figures and Unadjusted figures, and interchanges them without clearly identifying so. For example, the current Rate of 4.1% (for 4 months straight) is SeasAdj, and the real Rate is 4.5% for Jan 2018. I will use only the Unadjusted numbers, to help maintain clarity and transparency.
Some numbers may have a 0 placed as first digit, to maintain column form in this format.
The 1st column of numbers is the unemployed. The 2nd column is the Rate.
The 3rd column is what is called Marginally Attached to the Labor Force, which is included in the Want A Job Now category but NOT included in the Labor Force category and therefore excluded from the reported Unemployment category. The 5th column is the sum of Unemployed plus Marginally Attached - which more accurately represents the Actual Unemployed. The 6th column is the Rate for column 5 figure.
The 7th column is the Involuntary Part-Time workers, who are Not Employed Full Time due to poor Economy, and want, are able to work FT. The 8th column is the Rate for column 7. The 9th column is the sum of the 5th column plus 7th column. 10th column is the Rate for column 9 figure. The Rates in columns 2, 4, 6, 8, 10 have the denominator of Labor Force.
The 11th column is the Civilian Population. 12th column is Labor Force, 13th column is Participation Rate. 14th column is the published U-6 figure.
Figures in thousands.
MoYr Unemp Pct MrgAt Pct SbTtl Pct InvPT Pct Total Pcnt CivPop LbrFrc Prtc% U6%
Ja93 09911 07.9 2120 1.6 11612 09.0 6181 4.9 16575 12.8 192644 126034 65.4
Ja94 09492 07.3 2120 1.6 11612 09.0 4963 3.8 16575 12.8 195953 129393 66.0
Ja95 08101 06.2 1783 1.4 09884 07.6 4620 3.5 14504 11.1 197753 130698 66.1
Ja96 08270 06.3 1737 1.3 10007 07.6 4103 3.1 14110 10.7 199634 131396 65.8 10.8
Ja97 07933 05.9 1615 1.2 09548 07.1 4338 3.2 13886 10.3 202285 134317 66.4 10.4
Ja98 07069 05.2 1479 1.1 08548 06.3 4090 3.0 12638 09.3 204238 135951 66.6 09.3
Ja99 06604 04.8 1358 1.0 07962 05.8 3645 2.6 11607 08.4 206719 137943 66.7 08.5
Ja00 06316 04.5 1197 0.9 07513 05.4 3355 2.4 10868 07.8 208782 139621 66.9 07.8
Ja01 06647 04.7 1290 0.9 07937 05.6 3559 2.5 11496 08.2 210889 141049 66.9 08.1
Ja02 08935 06.3 1509 1.1 10444 07.4 4249 3.0 14693 10.4 213089 141074 66.2 10.5
Ja02 09051 06.3 1532 1.1 10583 07.4 4453 3.1 15036 10.5 216506 143228 66.2 10.5
Ja03 09395 06.5 1598 1.1 10993 07.6 5003 3.4 15996 11.0 219897 145301 66.1 11.0
Ja04 09144 06.3 1670 1.1 10814 07.4 5152 3.5 15966 10.9 222161 146068 65.7 10.9
Ja05 08444 05.7 1804 1.2 10248 07.0 4793 3.3 15041 10.2 224837 147125 65.4 10.2
Ja06 07608 05.1 1644 1.1 09252 06.2 4513 3.0 13765 09.2 227553 149090 65.5 09.2
Ja07 07649 05.0 1577 1.0 09226 06.1 4620 3.0 13846 09.1 230650 151924 65.9 09.1
Ja08 08221 05.4 1729 1.1 09950 06.5 5235 3.4 15185 09.9 232616 152828 65.7 09.9
Ja09 13009 08.5 2130 1.4 15139 09.9 8675 5.6 23814 15.5 234739 153445 65.4 15.4
Ja10 16147 10.6 2539 1.6 18686 12.2 9161 6.0 27847 18.2 236832 152957 64.6 18.0
Ja11 14937 09.8 2800 1.8 17737 11.6 9027 5.9 26764 17.5 238704 152536 63.9 17.3
Ja12 13541 08.8 2809 1.9 16350 10.7 8747 5.7 25097 16.4 242269 153485 63.4 16.2
Ja13 13181 08.5 2443 1.6 15624 10.1 8506 5.5 24130 15.6 244663 154794 63.3 15.4
Ja14 10855 07.0 2592 1.7 13447 08.7 7617 4.9
NOTIFY: Y | REPLY | REPLY WITH QUOTE | PERMALINK | TOP | HOME
This Table of Data, which includes Not Fully Employed Rate.
I will refer to this set of data as Table JSF-URF-3
I will post some actual numbers and let the comparisons and discussion follow.
The BLS uses both Seasonally Adjusted figures and Unadjusted figures, and interchanges them without clearly identifying so. I will use only the Unadjusted numbers, to help maintain clarity and transparency.
Some numbers may have a 0 placed as first digit, to maintain column form in this format.
The 1st column of numbers is the Unemployed.
The 2nd column is what is called Marginally Attached to the Labor Force, which is included in the Want A Job Now category but NOT included in the Labor Force category and therefore excluded from the reported Unemployment category.
The 3rd column is the Involuntary Part-Time workers, who are Not Employed Full Time due to poor Economy, and want, are able to work FT. The 4th column of numbers is the sum of the 1st, 2nd, and 3rd columns. 5th column is the Rate for column 4 figure, divided by Labor Force.
The 6th column of numbers is the Subtotal of columns 1 and 3, Unemployed plus Involuntary Part-Time.
The 7th column is Labor Force minus column 6. This is also Employed minus column 3 Involuntary Part-Time. This is not a figure identified by BLS, so I will call it Actually Fully Employed. This is Employed Full-time plus Voluntary Part-Time.
Not listed, but Civilian noninstitutional Population minus Actually Fully Employed is also a figure avoided by BLS, and I will call it Not Fully Employed, which is Unemployed plus Involuntary Part-Time plus Marginally Attached plus Not In Labor Force. The 8th column is Not Fully Employed Rate, which is divided by Civilian noninstitutional Population.
The 9th column is the Civilian Population. 10th column is Labor Force, 11th column is Participation Rate. 12th column is the published U-6 figure.
Figures in thousands.
Mo/Yr Unem MrgAt InvPT Totl Prct SbTtl AcEmpl NotEm CivPop LbrForc Prtc% U6%
Jan94 09492 2120 4963 16575 12.8 14455 114938 41.3% 195953 129393 66.0
Jan95 08101 1783 4620 14504 11.1 12721 117923 40.4% 197753 130698 66.1
Jan96 08270 1737 4103 14110 10.7 12373 119023 40.4% 199634 131396 65.8 10.8
Jan97 07933 1615 4338 13886 10.3 12271 122046 39.7% 202285 134317 66.4 10.4
Jan98 07069 1479 4090 12638 09.3 11159 124798 38.9% 204238 135951 66.6 09.3
Jan99 06604 1358 3645 11607 08.4 10249 127694 38.2% 206719 137943 66.7 08.5
Jan00 06316 1197 3355 10868 07.8 09671 129950 37.8% 208782 139621 66.9 07.8
Jan01 06647 1290 3559 11496 08.2 10206 130843 38.0% 210889 141049 66.9 08.1
Jan02 08935 1509 4249 14693 10.4 13184 127890 40.0% 213089 141074 66.2 10.5
Jan02 09051 1532 4453 15036 10.5 13504 129724 40.1% 216506 143228 66.2 10.5
Jan03 09395 1598 5003 15996 11.0 14398 130903 40.5% 219897 145301 66.1 11.0
Jan04 09144 1670 5152 15966 10.9 14296 131772 40.7% 222161 146068 65.7 10.9
Jan05 08444 1804 4793 15041 10.2 13237 133888 40.5% 224837 147125 65.4 10.2
Jan06 07608 1644 4513 13765 09.2 12122 136978 39.8% 227553 149090 65.5 09.2
Jan07 07649 1577 4620 13846 09.1 12269 139655 39.5% 230650 151924 65.9 09.1
Jan08 08221 1729 5235 15185 09.9 13456 139372 40.1% 232616 152828 65.7 09.9
Jan09 13009 2130 8675 23814 15.5 21684 131761 43.9% 234739 153445 65.4 15.4
Jan10 16147 2539 9161 27847 18.2 25308 127649 46.1% 236832 152957 64.6 18.0
Jan11 14937 2800 9027 26764 17.5 23964 128572 46.1% 238704 152536 63.9 17.3
Jan12 13541 2809 8747 25097 16.4 22288 131197 45.8% 242269 153485 63.4 16.2
Jan13 13181 2443 8506 24130 15.6 21687 133107 45.6% 244663 154794 63.3 15.4
Jan14 10855 2592 7617 21064 13.6 18472 135909 45.0% 246915 154381 62.5 13.5
Jan15 09498 2234 7125 1885
NOTIFY: Y | REPLY | REPLY WITH QUOTE | PERMALINK | TOP | HOME
The shadowstats site is lean on actual data, requiring a subscription to access what it claims as database.
However, I will make attempt to add in some of the data it presents. This does make assumption that their methodology and counting methods are valid, which I cannot find clear information about.
There also may be comingling of Seasonally Adjusted figures from shadowstats without clarity, but this will be the only series of Tables I post which veer from Not Seasonally Adjusted figures.
The charts they present do show that Unemployment under Trump is better than any time under Obamanomics, so it may be a worthwhile endeavor to investigate.
I will refer to this set of data as Table JSF-URF-5
I will post some actual numbers and let the comparisons and discussion follow. The documented shenanigans of Obamabots deliberately refusing to Report jobless data in the months before the 2012 Election are a different matter, I will just use the Fake Data they produced and pretend it was real.
The 1st column of numbers is the unemployed. The 2nd column is the Rate.
The 3rd column is the sum of the Unemployed plus Marginally Attached plus Involuntary Part-time. 4th column is the Rate for column 3 figure. The Rates in columns 2 and 4 have the denominator of Labor Force.
The 5th column is the Civilian Population. 6th column is Labor Force, 7th column is Participation Rate. 8th column is the published U-6 figure.
The 9th column is the Real Unemployment figure, as presented by shadowstats. The 10th column is the underreported, the difference between the U-6 figure from BLS and the Real figure from shadowstats.
Figures in thousands.
MoYr Unem Pcnt Total Prcnt CivPop LbrForc Prtc% U6% Real Separation
Ja93 09911 07.9 16575 12.8 192644 126034 65.4
Ja94 09492 07.3 16575 12.8 195953 129393 66.0 12% 15.3% 2.3%
Ja95 08101 06.2 14504 11.1 197753 130698 66.1 10% 13.5% 3.5%
Ja96 08270 06.3 14110 10.7 199634 131396 65.8 10.8% 13.5% 2.7%
Ja97 07933 05.9 13886 10.3 202285 134317 66.4 10.4% 13% 2.6%
Ja98 07069 05.2 12638 09.3 204238 135951 66.6 09.3% 12% 2.7%
Ja99 06604 04.8 11607 08.4 206719 137943 66.7 08.5% 11.5% 3.0%
Ja00 06316 04.5 10868 07.8 208782 139621 66.9 07.8% 11% 3.2%
Ja01 06647 04.7 11496 08.2 210889 141049 66.9 08.1% 10.5% 2.4%
Ja02 08935 06.3 14693 10.4 213089 141074 66.2 10.5% 13% 2.5%
Ja02 09051 06.3 15036 10.5 216506 143228 66.2 10.5% 13% 2.5%
Ja03 09395 06.5 15996 11.0 219897 145301 66.1 11.0% 13% 2.0%
Ja04 09144 06.3 15966 10.9 222161 146068 65.7 10.9% 14% 3.1%
Ja05 08444 05.7 15041 10.2 224837 147125 65.4 10.2% 13% 2.8%
Ja06 07608 05.1 13765 09.2 227553 149090 65.5 09.2% 12% 2.8%
Ja07 07649 05.0 13846 09.1 230650 151924 65.9 09.1% 12% 2.9%
Ja08 08221 05.4 15185 09.9 232616 152828 65.7 09.9% 13% 3.1%
Ja09 13009 08.5 23814 15.5 234739 153445 65.4 15.4% 20% 4.6%
Ja10 16147 10.6 27847 18.2 236832 152957 64.6 18.0% 22% 4.0%
Ja11 14937 09.8 26764 17.5 238704 152536 63.9 17.3% 22.5% 5.2%
Ja12 13541 08.8 25097 16.4 242269 153485 63.4 16.2% 22.5% 6.3%
Ja13 13181 08.5 24130 15.6 244663 154794 63.3 15.4% 23% 7.6%
Ja14 10855 07.0 21064 13.6 246915 154381 62.5 13.5% 23.5% 10%
Ja15 09498 06.1 18857 12.1 249723 156050 62.5 12.0% 23.5% 11.5%
Ja16 08309 05.3 16632 10.6 252397 157347 62.3 10.5% 23% 12.5%
Ja17 08149 05.1 16028 10.1 254082 158676 62.5 10.1% 23% 12.9%
Ja18 07189 04.5 14222 08.9 256780 160037 62.3 08.9% 22% 13.1%
Ja19 07140 04.4 14297 08.8 258239 162104 62.8 08.8% 21.8% 13.0%
Ja20 06504 04.0 12573 07.7 259502 163497 63.0 07.7% 21.0% 13.3%
Ja21 10851 06.8 19188 12.1 260851 159234 61.0 12.0% 25.7% 13.7%
Ja22 07207 04.4 12924 07.9 263202 162825 61.9 07.9% 24.5% 16.6%
Ja18 07189 04.5 14222 08.9 25
NOTIFY: Y | REPLY | REPLY WITH QUOTE | PERMALINK | TOP | HOME
This Table of Data, which breaks down the numerical changes in the key figures.
I will refer to this set of data as Table JSF-URF-6
I will post some actual numbers and let the comparisons and discussion follow.
The BLS uses both Seasonally Adjusted figures and Unadjusted figures, and interchanges them without clearly identifying so. I will use only the Unadjusted numbers, to help maintain clarity and transparency.
Some numbers may have a 0 placed as first digit, to maintain column form in this format.
The 1st column is Labor Force minus both Unemployed and Involuntary Part-Time. This is also Employed minus Involuntary Part-Time. This is not a figure identified by BLS, so I will call it Actually Fully Employed. This is Employed Full-time plus Voluntary Part-Time.
Not listed, but Civilian noninstitutional Population minus Actually Fully Employed is also a figure avoided by BLS, and I will call it Not Fully Employed, which is Unemployed plus Involuntary Part-Time plus Marginally Attached plus Not In Labor Force. The 2nd column is Not Fully Employed Rate, which is divided by Civilian noninstitutional Population.
The 3rd column is the Civilian Population. 4th column is Labor Force, 5th column is Participation Rate.
After the separation bar, the 7th column is the Increase in Civilian Population from the previous entry. For the entries by year, this is the 12 month Increase. For the entries broken down by month, this is the 1 month Increase.
The 8th column is the Increase in Labor Force from the previous entry.
The 9th column is the Increase in Actually Fully Employed count, from the previous entry.
In the monthly breakdown for 2018, after the second separation bar, the 10th column is the Civilian Population Increase from the entry 12 months prior.
The 11th column is the Labor Force Increase from the entry 12 months prior.
The 12th column is the Actually Fully Employed Increase from the entry 12 months prior.
The 13th column is the amount that the 12th column exceeds the 10th column, or the amount of Unemployed that is being chipped away, despite manipulation of other figures.
Figures in thousands.
Mo/Yr AcEmpl NtEm CiviPop LbrFrc Prtc% | CPIn LFIn AEInc
Jan94 114938 41.3% 195953 129393 66.0% |
Jan95 117923 40.4% 197753 130698 66.1% | 1800 1305 02985/+1185
Jan96 119023 40.4% 199634 131396 65.8% | 1881 0698 01100/-0781
Jan97 122046 39.7% 202285 134317 66.4% | 2651 2921 03023/+0372
Jan98 124798 38.9% 204238 135951 66.6% | 1953 1634 02752/+0799
Jan99 127694 38.2% 206719 137943 66.7% | 2481 1992 02896/+0415
Jan00 129950 37.8% 208782 139621 66.9% | 2063 1678 02256/+0193
Jan01 130843 38.0% 210889 141049 66.9% | 2107 1428 00893/-1214
Jan02 127890 40.0% 213089 141074 66.2% | 2200 0025 -2953/-5153
Jan02 129724 40.1% 216506 143228 66.2% | 5617 2179 -1119/-6736
Jan03 130903 40.5% 219897 145301 66.1% | 3391 2073 01179/-2212
Jan04 131772 40.7% 222161 146068 65.7% | 2264 0767 00869/-1395
Jan05 133888 40.5% 224837 147125 65.4% | 2676 1057 02116/-0560
Jan06 136978 39.8% 227553 149090 65.5% | 2716 1965 03090/+0374
Jan07 139655 39.5% 230650 151924 65.9% | 3097 2834 02677/-0420
Jan08 139372 40.1% 232616 152828 65.7% | 1966 0904 -0283/-2249
Jan09 131761 43.9% 234739 153445 65.4% | 2123 0617 -7611/-9734
Jan10 127649 46.1% 236832 152957 64.6% | 2093 -488 -4112/-6205
Jan11 128572 46.1% 238704 152536 63.9% | 1872 -421 00923/-0949
Jan12 131197 45.8% 242269 153485 63.4% | 3565 0949 02625/-0940
Jan13 133107 45.6% 244663 154794 63.3% | 2394 1309 01910/-0484
Jan14 135909 45.0% 246915 154381 62.5% | 2252 -413 02802/+0550
Jan15 139427 44.2% 249723 156050 62.5% | 2808 1669 03518/+0710
Jan16 1428
NOTIFY: Y | REPLY | REPLY WITH QUOTE | PERMALINK | TOP | HOME
Updating with Jobs Report data from today:
I will refer to this set of data as Table JSF-URF-1
Jan 2002 is listed twice. First with original report data from February 2002. Second with revised data from new Census data, published in February 2003.
Quote:
Originally posted by JEWELSTAITEFAN:
BLS currently defines the Want A Job category as not being part of the Labor Force.
So I will post some actual numbers and let the comparisons and discussion follow. The documented shenanigans of Obamabots deliberately refusing to Report jobless data in the months before the 2012 Election are a different matter, I will just use the Fake Data they produced and pretend it was real.
I will use only the Unadjusted numbers, to help maintain clarity and transparency.
Mo/Yr Unemp Pcnt WAJb Pcnt SubTtl Pcnt InvPT Pcnt Total Prcnt CivPop LbrFrc Prtc% U-6
Jan98 07069 05.2% 5026 3.7% 12095 08.9% 4090 3.0% 16185 11.9% 204238 135951 66.6 09.3
Jan99 06604 04.8% 4800 3.5% 11404 08.3% 3645 2.6% 15049 10.9% 206719 137943 66.7 08.5
Jan00 06316 04.5% 4354 3.1% 10670 07.6% 3355 2.4% 14025 10.0% 208782 139621 66.9 07.8
Jan01 06647 04.7% 4474 3.2% 11121 07.9% 3559 2.5% 14680 10.4% 210889 141049 66.9 08.1
Jan02 08935 06.3% 4872 3.5% 13807 09.8% 4249 3.0% 18056 12.8% 213089 141074 66.2 10.5
Jan02 09051 06.3% 4938 3.4% 13989 09.8% 4453 3.1% 18442 12.9% 216506 143228 66.2 10.5
Jan03 09395 06.5% 4779 3.3% 14174 09.8% 5003 3.4% 19177 13.2% 219897 145301 66.1 11.0
Jan04 09144 06.3% 4913 3.4% 14057 09.6% 5152 3.5% 19209 13.2% 222161 146068 65.7 10.9
Jan05 08444 05.7% 5136 3.5% 13580 09.2% 4793 3.3% 18373 12.5% 224837 147125 65.4 10.2
Jan06 07608 05.1% 5095 3.4% 12703 08.5% 4513 3.0% 17216 11.5% 227553 149090 65.5 09.2
Jan07 07649 05.0% 4633 3.0% 12282 08.1% 4620 3.0% 16902 11.1% 230650 151924 65.9 09.1
Jan08 08221 05.4% 4977 3.2% 13198 08.6% 5235 3.5% 18433 12.1% 232616 152828 65.7 09.9
Jan09 13009 08.5% 5866 3.8% 18875 12.3% 8675 5.7% 27550 18.0% 234739 153445 65.4 15.4
Jan10 16147 10.6% 6108 4.0% 22255 14.6% 9161 5.9% 31416 20.5% 236832 152957 64.6 18.0
Jan11 14937 09.8% 6643 4.3% 21580 14.1% 9027 6.0% 30607 20.1% 238704 152536 63.9 17.3
Jan12 13541 08.8% 6495 4.3% 20036 13.1% 8747 5.7% 28783 18.8% 242269 153485 63.4 16.2
Jan13 13181 08.5% 6781 4.4% 19962 12.9% 8506 5.5% 28468 18.4% 244663 154794 63.3 15.4
Jan14 10855 07.0% 6508 4.2% 17363 11.2% 7617 5.0% 24980 16.2% 246915 154381 62.5 13.5
Jan15 09498 06.1% 6467 4.1% 15965 10.2% 7125 4.6% 23090 14.8% 249723 156050 62.5 12.0
Jan16 08309 05.3% 6166 3.9% 14475 09.2% 6234 4.0% 20709 13.2% 252397 157347 62.3 10.5
Jan17 08149 05.1% 5934 3.8% 14083 08.9% 6127 3.8% 20210 12.7% 254082 158676 62.5 10.1
Jan18 07189 04.5% 5364 3.3% 12553 07.8% 5380 3.4% 17933 11.2% 256780 160037 62.3 08.9
Jan19 07140 04.4% 5435 3.4% 12575 07.8% 5543 3.4% 18118 11.2% 258239 162104 62.8 08.8
Jan20 06504 04.0% 5107 3.1% 11611 07.1% 4605 2.8% 16216 09.9% 259502 163497 63.0 07.7
Jan21 10851 06.8% 7129 4.5% 17980 11.3% 6284 3.9% 24264 15.2% 260851 159234 61.0 12.0
Jan22 07207 04.4% 5872 3.6% 13079 08.0%
NOTIFY: Y | REPLY | REPLY WITH QUOTE | PERMALINK | TOP | HOME
Updating with today's Jobs Report to this Table of Data, which seems to best show the components of U6:
I will refer to this set of data as Table JSF-URF-2
Note: this year the Marginally Attached data is in Table A-16 of the report.
Quote:
I will post some actual numbers and let the comparisons and discussion follow. The documented shenanigans of Obamabots deliberately refusing to Report jobless data in the months before the 2012 Election are a different matter, I will just use the Fake Data they produced and pretend it was real.
The BLS uses both Seasonally Adjusted figures and Unadjusted figures, and interchanges them without clearly identifying so. For example, the current Rate of 4.1% (for 4 months straight) is SeasAdj, and the real Rate is 4.5% for Jan 2018. I will use only the Unadjusted numbers, to help maintain clarity and transparency.
Some numbers may have a 0 placed as first digit, to maintain column form in this format.
The 1st column of numbers is the unemployed. The 2nd column is the Rate.
The 3rd column is what is called Marginally Attached to the Labor Force, which is included in the Want A Job Now category but NOT included in the Labor Force category and therefore excluded from the reported Unemployment category. The 5th column is the sum of Unemployed plus Marginally Attached - which more accurately represents the Actual Unemployed. The 6th column is the Rate for column 5 figure.
The 7th column is the Involuntary Part-Time workers, who are Not Employed Full Time due to poor Economy, and want, are able to work FT. The 8th column is the Rate for column 7. The 9th column is the sum of the 5th column plus 7th column. 10th column is the Rate for column 9 figure. The Rates in columns 2, 4, 6, 8, 10 have the denominator of Labor Force.
The 11th column is the Civilian Population. 12th column is Labor Force, 13th column is Participation Rate. 14th column is the published U-6 figure.
Figures in thousands.
MoYr Unemp Pct MrgAt Pct SbTtl Pct InvPT Pct Total Pcnt CivPop LbrFrc Prtc% U6%
Ja93 09911 07.9 2120 1.6 11612 09.0 6181 4.9 16575 12.8 192644 126034 65.4
Ja94 09492 07.3 2120 1.6 11612 09.0 4963 3.8 16575 12.8 195953 129393 66.0
Ja95 08101 06.2 1783 1.4 09884 07.6 4620 3.5 14504 11.1 197753 130698 66.1
Ja96 08270 06.3 1737 1.3 10007 07.6 4103 3.1 14110 10.7 199634 131396 65.8 10.8
Ja97 07933 05.9 1615 1.2 09548 07.1 4338 3.2 13886 10.3 202285 134317 66.4 10.4
Ja98 07069 05.2 1479 1.1 08548 06.3 4090 3.0 12638 09.3 204238 135951 66.6 09.3
Ja99 06604 04.8 1358 1.0 07962 05.8 3645 2.6 11607 08.4 206719 137943 66.7 08.5
Ja00 06316 04.5 1197 0.9 07513 05.4 3355 2.4 10868 07.8 208782 139621 66.9 07.8
Ja01 06647 04.7 1290 0.9 07937 05.6 3559 2.5 11496 08.2 210889 141049 66.9 08.1
Ja02 08935 06.3 1509 1.1 10444 07.4 4249 3.0 14693 10.4 213089 141074 66.2 10.5
Ja02 09051 06.3 1532 1.1 10583 07.4 4453 3.1 15036 10.5 216506 143228 66.2 10.5
Ja03 09395 06.5 1598 1.1 10993 07.6 5003 3.4 15996 11.0 219897 145301 66.1 11.0
Ja04 09144 06.3 1670 1.1 10814 07.4 5152 3.5 15966 10.9 222161 146068 65.7 10.9
Ja05 08444 05.7 1804 1.2 10248 07.0 4793 3.3 15041 10.2 224837 147125 65.4 10.2
Ja06 07608 05.1 1644 1.1 09252 06.2 4513 3.0 13765 09.2 227553 149090 65.5 09.2
Ja07 07649 05.0 1577 1.0 09226 06.1 4620 3.0 13846 09.1 230650 151924 65.9 09.1
Ja08 08221 05.4 1729 1.1 09950 06.5 5235 3.4 15185 09.9 232616 152828 65.7 09.9
Ja09 13009 08.5 2130 1.4 15139 09.9 8675 5.6 23814 15.5 234739 153445 65.4 15.4
Ja10 16147 10.6 2539 1.6 18686 12.2 9161 6.0 27847 18.2 236832 152957 64.6 18.0
Ja11 14937 09.8 2800 1.8 17737 11.6 9027 5.9 26764 17.5 238704 152536 63.9 17.3
Ja12 13541 08.8 2809 1.9 16350 10.7 8747 5.7 25097 16.4 242269 153485 63.4 16.2
Ja13 13181 08.5 2443 1.6 15624 10.1 8506 5.5 24130 15.6 244663 154794 63.3 15.4
Ja14 10855 07.0 2592 1.7 13447 08.7 7617 4.9 2
NOTIFY: Y | REPLY | REPLY WITH QUOTE | PERMALINK | TOP | HOME
This Table of Data, which includes Not Fully Employed Rate.
I will refer to this set of data as Table JSF-URF-3
I will post some actual numbers and let the comparisons and discussion follow.
The BLS uses both Seasonally Adjusted figures and Unadjusted figures, and interchanges them without clearly identifying so. I will use only the Unadjusted numbers, to help maintain clarity and transparency.
Some numbers may have a 0 placed as first digit, to maintain column form in this format.
The 1st column of numbers is the Unemployed.
The 2nd column is what is called Marginally Attached to the Labor Force, which is included in the Want A Job Now category but NOT included in the Labor Force category and therefore excluded from the reported Unemployment category.
The 3rd column is the Involuntary Part-Time workers, who are Not Employed Full Time due to poor Economy, and want, are able to work FT. The 4th column of numbers is the sum of the 1st, 2nd, and 3rd columns. 5th column is the Rate for column 4 figure, divided by Labor Force.
The 6th column of numbers is the Subtotal of columns 1 and 3, Unemployed plus Involuntary Part-Time.
The 7th column is Labor Force minus column 6. This is also Employed minus column 3 Involuntary Part-Time. This is not a figure identified by BLS, so I will call it Actually Fully Employed. This is Employed Full-time plus Voluntary Part-Time.
Not listed, but Civilian noninstitutional Population minus Actually Fully Employed is also a figure avoided by BLS, and I will call it Not Fully Employed, which is Unemployed plus Involuntary Part-Time plus Marginally Attached plus Not In Labor Force. The 8th column is Not Fully Employed Rate, which is divided by Civilian noninstitutional Population.
The 9th column is the Civilian Population. 10th column is Labor Force, 11th column is Participation Rate. 12th column is the published U-6 figure.
Figures in thousands.
Mo/Yr Unem MrgAt InvPT Totl Prct SbTtl AcEmpl NotEm CivPop LbrForc Prtc% U6%
Jan94 09492 2120 4963 16575 12.8 14455 114938 41.3% 195953 129393 66.0
Jan95 08101 1783 4620 14504 11.1 12721 117923 40.4% 197753 130698 66.1
Jan96 08270 1737 4103 14110 10.7 12373 119023 40.4% 199634 131396 65.8 10.8
Jan97 07933 1615 4338 13886 10.3 12271 122046 39.7% 202285 134317 66.4 10.4
Jan98 07069 1479 4090 12638 09.3 11159 124798 38.9% 204238 135951 66.6 09.3
Jan99 06604 1358 3645 11607 08.4 10249 127694 38.2% 206719 137943 66.7 08.5
Jan00 06316 1197 3355 10868 07.8 09671 129950 37.8% 208782 139621 66.9 07.8
Jan01 06647 1290 3559 11496 08.2 10206 130843 38.0% 210889 141049 66.9 08.1
Jan02 08935 1509 4249 14693 10.4 13184 127890 40.0% 213089 141074 66.2 10.5
Jan02 09051 1532 4453 15036 10.5 13504 129724 40.1% 216506 143228 66.2 10.5
Jan03 09395 1598 5003 15996 11.0 14398 130903 40.5% 219897 145301 66.1 11.0
Jan04 09144 1670 5152 15966 10.9 14296 131772 40.7% 222161 146068 65.7 10.9
Jan05 08444 1804 4793 15041 10.2 13237 133888 40.5% 224837 147125 65.4 10.2
Jan06 07608 1644 4513 13765 09.2 12122 136978 39.8% 227553 149090 65.5 09.2
Jan07 07649 1577 4620 13846 09.1 12269 139655 39.5% 230650 151924 65.9 09.1
Jan08 08221 1729 5235 15185 09.9 13456 139372 40.1% 232616 152828 65.7 09.9
Jan09 13009 2130 8675 23814 15.5 21684 131761 43.9% 234739 153445 65.4 15.4
Jan10 16147 2539 9161 27847 18.2 25308 127649 46.1% 236832 152957 64.6 18.0
Jan11 14937 2800 9027 26764 17.5 23964 128572 46.1% 238704 152536 63.9 17.3
Jan12 13541 2809 8747 25097 16.4 22288 131197 45.8% 242269 153485 63.4 16.2
Jan13 13181 2443 8506 24130 15.6 21687 133107 45.6% 244663 154794 63.3 15.4
Jan14 10855 2592 7617 21064 13.6 18472 135909 45.0% 246915 154381 62.5 13.5
Jan15 09498 2234 7125 1885
NOTIFY: Y | REPLY | REPLY WITH QUOTE | PERMALINK | TOP | HOME
The shadowstats site is lean on actual data, requiring a subscription to access what it claims as database.
However, I will make attempt to add in some of the data it presents. This does make assumption that their methodology and counting methods are valid, which I cannot find clear information about.
There also may be comingling of Seasonally Adjusted figures from shadowstats without clarity, but this will be the only series of Tables I post which veer from Not Seasonally Adjusted figures.
The charts they present do show that Unemployment under Trump is better than any time under Obamanomics, so it may be a worthwhile endeavor to investigate.
I will refer to this set of data as Table JSF-URF-5
I will post some actual numbers and let the comparisons and discussion follow. The documented shenanigans of Obamabots deliberately refusing to Report jobless data in the months before the 2012 Election are a different matter, I will just use the Fake Data they produced and pretend it was real.
The 1st column of numbers is the unemployed. The 2nd column is the Rate.
The 3rd column is the sum of the Unemployed plus Marginally Attached plus Involuntary Part-time. 4th column is the Rate for column 3 figure. The Rates in columns 2 and 4 have the denominator of Labor Force.
The 5th column is the Civilian Population. 6th column is Labor Force, 7th column is Participation Rate. 8th column is the published U-6 figure.
The 9th column is the Real Unemployment figure, as presented by shadowstats. The 10th column is the underreported, the difference between the U-6 figure from BLS and the Real figure from shadowstats.
Figures in thousands.
MoYr Unem Pcnt Total Prcnt CivPop LbrForc Prtc% U6% Real Separation
Ja93 09911 07.9 16575 12.8 192644 126034 65.4
Ja94 09492 07.3 16575 12.8 195953 129393 66.0 12% 15.3% 2.3%
Ja95 08101 06.2 14504 11.1 197753 130698 66.1 10% 13.5% 3.5%
Ja96 08270 06.3 14110 10.7 199634 131396 65.8 10.8% 13.5% 2.7%
Ja97 07933 05.9 13886 10.3 202285 134317 66.4 10.4% 13% 2.6%
Ja98 07069 05.2 12638 09.3 204238 135951 66.6 09.3% 12% 2.7%
Ja99 06604 04.8 11607 08.4 206719 137943 66.7 08.5% 11.5% 3.0%
Ja00 06316 04.5 10868 07.8 208782 139621 66.9 07.8% 11% 3.2%
Ja01 06647 04.7 11496 08.2 210889 141049 66.9 08.1% 10.5% 2.4%
Ja02 08935 06.3 14693 10.4 213089 141074 66.2 10.5% 13% 2.5%
Ja02 09051 06.3 15036 10.5 216506 143228 66.2 10.5% 13% 2.5%
Ja03 09395 06.5 15996 11.0 219897 145301 66.1 11.0% 13% 2.0%
Ja04 09144 06.3 15966 10.9 222161 146068 65.7 10.9% 14% 3.1%
Ja05 08444 05.7 15041 10.2 224837 147125 65.4 10.2% 13% 2.8%
Ja06 07608 05.1 13765 09.2 227553 149090 65.5 09.2% 12% 2.8%
Ja07 07649 05.0 13846 09.1 230650 151924 65.9 09.1% 12% 2.9%
Ja08 08221 05.4 15185 09.9 232616 152828 65.7 09.9% 13% 3.1%
Ja09 13009 08.5 23814 15.5 234739 153445 65.4 15.4% 20% 4.6%
Ja10 16147 10.6 27847 18.2 236832 152957 64.6 18.0% 22% 4.0%
Ja11 14937 09.8 26764 17.5 238704 152536 63.9 17.3% 22.5% 5.2%
Ja12 13541 08.8 25097 16.4 242269 153485 63.4 16.2% 22.5% 6.3%
Ja13 13181 08.5 24130 15.6 244663 154794 63.3 15.4% 23% 7.6%
Ja14 10855 07.0 21064 13.6 246915 154381 62.5 13.5% 23.5% 10%
Ja15 09498 06.1 18857 12.1 249723 156050 62.5 12.0% 23.5% 11.5%
Ja16 08309 05.3 16632 10.6 252397 157347 62.3 10.5% 23% 12.5%
Ja17 08149 05.1 16028 10.1 254082 158676 62.5 10.1% 23% 12.9%
Ja18 07189 04.5 14222 08.9 256780 160037 62.3 08.9% 22% 13.1%
Ja19 07140 04.4 14297 08.8 258239 162104 62.8 08.8% 21.8% 13.0%
Ja20 06504 04.0 12573 07.7 259502 163497 63.0 07.7% 21.0% 13.3%
Ja21 10851 06.8 19188 12.1 260851 159234 61.0 12.0% 25.7% 13.7%
Ja22 07207 04.4 12924 07.9 263202 162825 61.9 07.9% 24.5% 16.6%
Ja18 07189 04.5 14222 08.9 25
NOTIFY: Y | REPLY | REPLY WITH QUOTE | PERMALINK | TOP | HOME
This Table of Data, which breaks down the numerical changes in the key figures.
I will refer to this set of data as Table JSF-URF-6
I will post some actual numbers and let the comparisons and discussion follow.
The BLS uses both Seasonally Adjusted figures and Unadjusted figures, and interchanges them without clearly identifying so. I will use only the Unadjusted numbers, to help maintain clarity and transparency.
Some numbers may have a 0 placed as first digit, to maintain column form in this format.
The 1st column is Labor Force minus both Unemployed and Involuntary Part-Time. This is also Employed minus Involuntary Part-Time. This is not a figure identified by BLS, so I will call it Actually Fully Employed. This is Employed Full-time plus Voluntary Part-Time.
Not listed, but Civilian noninstitutional Population minus Actually Fully Employed is also a figure avoided by BLS, and I will call it Not Fully Employed, which is Unemployed plus Involuntary Part-Time plus Marginally Attached plus Not In Labor Force. The 2nd column is Not Fully Employed Rate, which is divided by Civilian noninstitutional Population.
The 3rd column is the Civilian Population. 4th column is Labor Force, 5th column is Participation Rate.
After the separation bar, the 7th column is the Increase in Civilian Population from the previous entry. For the entries by year, this is the 12 month Increase. For the entries broken down by month, this is the 1 month Increase.
The 8th column is the Increase in Labor Force from the previous entry.
The 9th column is the Increase in Actually Fully Employed count, from the previous entry.
In the monthly breakdown for 2018, after the second separation bar, the 10th column is the Civilian Population Increase from the entry 12 months prior.
The 11th column is the Labor Force Increase from the entry 12 months prior.
The 12th column is the Actually Fully Employed Increase from the entry 12 months prior.
The 13th column is the amount that the 12th column exceeds the 10th column, or the amount of Unemployed that is being chipped away, despite manipulation of other figures.
Figures in thousands.
Mo/Yr AcEmpl NtEm CiviPop LbrFrc Prtc% | CPIn LFIn AEInc
Jan94 114938 41.3% 195953 129393 66.0% |
Jan95 117923 40.4% 197753 130698 66.1% | 1800 1305 02985/+1185
Jan96 119023 40.4% 199634 131396 65.8% | 1881 0698 01100/-0781
Jan97 122046 39.7% 202285 134317 66.4% | 2651 2921 03023/+0372
Jan98 124798 38.9% 204238 135951 66.6% | 1953 1634 02752/+0799
Jan99 127694 38.2% 206719 137943 66.7% | 2481 1992 02896/+0415
Jan00 129950 37.8% 208782 139621 66.9% | 2063 1678 02256/+0193
Jan01 130843 38.0% 210889 141049 66.9% | 2107 1428 00893/-1214
Jan02 127890 40.0% 213089 141074 66.2% | 2200 0025 -2953/-5153
Jan02 129724 40.1% 216506 143228 66.2% | 5617 2179 -1119/-6736
Jan03 130903 40.5% 219897 145301 66.1% | 3391 2073 01179/-2212
Jan04 131772 40.7% 222161 146068 65.7% | 2264 0767 00869/-1395
Jan05 133888 40.5% 224837 147125 65.4% | 2676 1057 02116/-0560
Jan06 136978 39.8% 227553 149090 65.5% | 2716 1965 03090/+0374
Jan07 139655 39.5% 230650 151924 65.9% | 3097 2834 02677/-0420
Jan08 139372 40.1% 232616 152828 65.7% | 1966 0904 -0283/-2249
Jan09 131761 43.9% 234739 153445 65.4% | 2123 0617 -7611/-9734
Jan10 127649 46.1% 236832 152957 64.6% | 2093 -488 -4112/-6205
Jan11 128572 46.1% 238704 152536 63.9% | 1872 -421 00923/-0949
Jan12 131197 45.8% 242269 153485 63.4% | 3565 0949 02625/-0940
Jan13 133107 45.6% 244663 154794 63.3% | 2394 1309 01910/-0484
Jan14 135909 45.0% 246915 154381 62.5% | 2252 -413 02802/+0550
Jan15 139427 44.2% 249723 156050 62.5% | 2808 1669 03518/+0710
Jan16 1428
NOTIFY: Y | REPLY | REPLY WITH QUOTE | PERMALINK | TOP | HOME
NOTIFY: Y | REPLY | REPLY WITH QUOTE | PERMALINK | TOP | HOME
Updating with Jobs Report data from last week Friday:
I will refer to this set of data as Table JSF-URF-1
Jan 2002 is listed twice. First with original report data from February 2002. Second with revised data from new Census data, published in February 2003.
Quote:
Originally posted by JEWELSTAITEFAN:
BLS currently defines the Want A Job category as not being part of the Labor Force.
So I will post some actual numbers and let the comparisons and discussion follow. The documented shenanigans of Obamabots deliberately refusing to Report jobless data in the months before the 2012 Election are a different matter, I will just use the Fake Data they produced and pretend it was real.
I will use only the Unadjusted numbers, to help maintain clarity and transparency.
Mo/Yr Unemp Pcnt WAJb Pcnt SubTtl Pcnt InvPT Pcnt Total Prcnt CivPop LbrFrc Prtc% U-6
Jan98 07069 05.2% 5026 3.7% 12095 08.9% 4090 3.0% 16185 11.9% 204238 135951 66.6 09.3
Jan99 06604 04.8% 4800 3.5% 11404 08.3% 3645 2.6% 15049 10.9% 206719 137943 66.7 08.5
Jan00 06316 04.5% 4354 3.1% 10670 07.6% 3355 2.4% 14025 10.0% 208782 139621 66.9 07.8
Jan01 06647 04.7% 4474 3.2% 11121 07.9% 3559 2.5% 14680 10.4% 210889 141049 66.9 08.1
Jan02 08935 06.3% 4872 3.5% 13807 09.8% 4249 3.0% 18056 12.8% 213089 141074 66.2 10.5
Jan02 09051 06.3% 4938 3.4% 13989 09.8% 4453 3.1% 18442 12.9% 216506 143228 66.2 10.5
Jan03 09395 06.5% 4779 3.3% 14174 09.8% 5003 3.4% 19177 13.2% 219897 145301 66.1 11.0
Jan04 09144 06.3% 4913 3.4% 14057 09.6% 5152 3.5% 19209 13.2% 222161 146068 65.7 10.9
Jan05 08444 05.7% 5136 3.5% 13580 09.2% 4793 3.3% 18373 12.5% 224837 147125 65.4 10.2
Jan06 07608 05.1% 5095 3.4% 12703 08.5% 4513 3.0% 17216 11.5% 227553 149090 65.5 09.2
Jan07 07649 05.0% 4633 3.0% 12282 08.1% 4620 3.0% 16902 11.1% 230650 151924 65.9 09.1
Jan08 08221 05.4% 4977 3.2% 13198 08.6% 5235 3.5% 18433 12.1% 232616 152828 65.7 09.9
Jan09 13009 08.5% 5866 3.8% 18875 12.3% 8675 5.7% 27550 18.0% 234739 153445 65.4 15.4
Jan10 16147 10.6% 6108 4.0% 22255 14.6% 9161 5.9% 31416 20.5% 236832 152957 64.6 18.0
Jan11 14937 09.8% 6643 4.3% 21580 14.1% 9027 6.0% 30607 20.1% 238704 152536 63.9 17.3
Jan12 13541 08.8% 6495 4.3% 20036 13.1% 8747 5.7% 28783 18.8% 242269 153485 63.4 16.2
Jan13 13181 08.5% 6781 4.4% 19962 12.9% 8506 5.5% 28468 18.4% 244663 154794 63.3 15.4
Jan14 10855 07.0% 6508 4.2% 17363 11.2% 7617 5.0% 24980 16.2% 246915 154381 62.5 13.5
Jan15 09498 06.1% 6467 4.1% 15965 10.2% 7125 4.6% 23090 14.8% 249723 156050 62.5 12.0
Jan16 08309 05.3% 6166 3.9% 14475 09.2% 6234 4.0% 20709 13.2% 252397 157347 62.3 10.5
Jan17 08149 05.1% 5934 3.8% 14083 08.9% 6127 3.8% 20210 12.7% 254082 158676 62.5 10.1
Jan18 07189 04.5% 5364 3.3% 12553 07.8% 5380 3.4% 17933 11.2% 256780 160037 62.3 08.9
Jan19 07140 04.4% 5435 3.4% 12575 07.8% 5543 3.4% 18118 11.2% 258239 162104 62.8 08.8
Jan20 06504 04.0% 5107 3.1% 11611 07.1% 4605 2.8% 16216 09.9% 259502 163497 63.0 07.7
Jan21 10851 06.8% 7129 4.5% 17980 11.3% 6284 3.9% 24264 15.2% 260851 159234 61.0 12.0
Jan22 07207 04.4% 5872 3.6% 1
NOTIFY: Y | REPLY | REPLY WITH QUOTE | PERMALINK | TOP | HOME
Updating with today's Jobs Report to this Table of Data, which seems to best show the components of U6:
I will refer to this set of data as Table JSF-URF-2
Note: this year the Marginally Attached data is in Table A-16 of the report.
Quote:
I will post some actual numbers and let the comparisons and discussion follow. The documented shenanigans of Obamabots deliberately refusing to Report jobless data in the months before the 2012 Election are a different matter, I will just use the Fake Data they produced and pretend it was real.
The BLS uses both Seasonally Adjusted figures and Unadjusted figures, and interchanges them without clearly identifying so. For example, the current Rate of 4.1% (for 4 months straight) is SeasAdj, and the real Rate is 4.5% for Jan 2018. I will use only the Unadjusted numbers, to help maintain clarity and transparency.
Some numbers may have a 0 placed as first digit, to maintain column form in this format.
The 1st column of numbers is the unemployed. The 2nd column is the Rate.
The 3rd column is what is called Marginally Attached to the Labor Force, which is included in the Want A Job Now category but NOT included in the Labor Force category and therefore excluded from the reported Unemployment category. The 5th column is the sum of Unemployed plus Marginally Attached - which more accurately represents the Actual Unemployed. The 6th column is the Rate for column 5 figure.
The 7th column is the Involuntary Part-Time workers, who are Not Employed Full Time due to poor Economy, and want, are able to work FT. The 8th column is the Rate for column 7. The 9th column is the sum of the 5th column plus 7th column. 10th column is the Rate for column 9 figure. The Rates in columns 2, 4, 6, 8, 10 have the denominator of Labor Force.
The 11th column is the Civilian Population. 12th column is Labor Force, 13th column is Participation Rate. 14th column is the published U-6 figure.
Figures in thousands.
MoYr Unemp Pct MrgAt Pct SbTtl Pct InvPT Pct Total Pcnt CivPop LbrFrc Prtc% U6%
Ja93 09911 07.9 2120 1.6 11612 09.0 6181 4.9 16575 12.8 192644 126034 65.4
Ja94 09492 07.3 2120 1.6 11612 09.0 4963 3.8 16575 12.8 195953 129393 66.0
Ja95 08101 06.2 1783 1.4 09884 07.6 4620 3.5 14504 11.1 197753 130698 66.1
Ja96 08270 06.3 1737 1.3 10007 07.6 4103 3.1 14110 10.7 199634 131396 65.8 10.8
Ja97 07933 05.9 1615 1.2 09548 07.1 4338 3.2 13886 10.3 202285 134317 66.4 10.4
Ja98 07069 05.2 1479 1.1 08548 06.3 4090 3.0 12638 09.3 204238 135951 66.6 09.3
Ja99 06604 04.8 1358 1.0 07962 05.8 3645 2.6 11607 08.4 206719 137943 66.7 08.5
Ja00 06316 04.5 1197 0.9 07513 05.4 3355 2.4 10868 07.8 208782 139621 66.9 07.8
Ja01 06647 04.7 1290 0.9 07937 05.6 3559 2.5 11496 08.2 210889 141049 66.9 08.1
Ja02 08935 06.3 1509 1.1 10444 07.4 4249 3.0 14693 10.4 213089 141074 66.2 10.5
Ja02 09051 06.3 1532 1.1 10583 07.4 4453 3.1 15036 10.5 216506 143228 66.2 10.5
Ja03 09395 06.5 1598 1.1 10993 07.6 5003 3.4 15996 11.0 219897 145301 66.1 11.0
Ja04 09144 06.3 1670 1.1 10814 07.4 5152 3.5 15966 10.9 222161 146068 65.7 10.9
Ja05 08444 05.7 1804 1.2 10248 07.0 4793 3.3 15041 10.2 224837 147125 65.4 10.2
Ja06 07608 05.1 1644 1.1 09252 06.2 4513 3.0 13765 09.2 227553 149090 65.5 09.2
Ja07 07649 05.0 1577 1.0 09226 06.1 4620 3.0 13846 09.1 230650 151924 65.9 09.1
Ja08 08221 05.4 1729 1.1 09950 06.5 5235 3.4 15185 09.9 232616 152828 65.7 09.9
Ja09 13009 08.5 2130 1.4 15139 09.9 8675 5.6 23814 15.5 234739 153445 65.4 15.4
Ja10 16147 10.6 2539 1.6 18686 12.2 9161 6.0 27847 18.2 236832 152957 64.6 18.0
Ja11 14937 09.8 2800 1.8 17737 11.6 9027 5.9 26764 17.5 238704 152536 63.9 17.3
Ja12 13541 08.8 2809 1.9 16350 10.7 8747 5.7 25097 16.4 242269 153485 63.4 16.2
Ja13 13181 08.5 2443 1.6 15624 10.1 8506 5.5 24130 15.6 244663 154794 63.3 15.4
Ja14 10855 07.0 2592 1.7 13447 08.7 7617 4.9 2
NOTIFY: Y | REPLY | REPLY WITH QUOTE | PERMALINK | TOP | HOME
This Table of Data, which includes Not Fully Employed Rate.
I will refer to this set of data as Table JSF-URF-3
I will post some actual numbers and let the comparisons and discussion follow.
The BLS uses both Seasonally Adjusted figures and Unadjusted figures, and interchanges them without clearly identifying so. I will use only the Unadjusted numbers, to help maintain clarity and transparency.
Some numbers may have a 0 placed as first digit, to maintain column form in this format.
The 1st column of numbers is the Unemployed.
The 2nd column is what is called Marginally Attached to the Labor Force, which is included in the Want A Job Now category but NOT included in the Labor Force category and therefore excluded from the reported Unemployment category.
The 3rd column is the Involuntary Part-Time workers, who are Not Employed Full Time due to poor Economy, and want, are able to work FT. The 4th column of numbers is the sum of the 1st, 2nd, and 3rd columns. 5th column is the Rate for column 4 figure, divided by Labor Force.
The 6th column of numbers is the Subtotal of columns 1 and 3, Unemployed plus Involuntary Part-Time.
The 7th column is Labor Force minus column 6. This is also Employed minus column 3 Involuntary Part-Time. This is not a figure identified by BLS, so I will call it Actually Fully Employed. This is Employed Full-time plus Voluntary Part-Time.
Not listed, but Civilian noninstitutional Population minus Actually Fully Employed is also a figure avoided by BLS, and I will call it Not Fully Employed, which is Unemployed plus Involuntary Part-Time plus Marginally Attached plus Not In Labor Force. The 8th column is Not Fully Employed Rate, which is divided by Civilian noninstitutional Population.
The 9th column is the Civilian Population. 10th column is Labor Force, 11th column is Participation Rate. 12th column is the published U-6 figure.
Figures in thousands.
Mo/Yr Unem MrgAt InvPT Totl Prct SbTtl AcEmpl NotEm CivPop LbrForc Prtc% U6%
Jan94 09492 2120 4963 16575 12.8 14455 114938 41.3% 195953 129393 66.0
Jan95 08101 1783 4620 14504 11.1 12721 117923 40.4% 197753 130698 66.1
Jan96 08270 1737 4103 14110 10.7 12373 119023 40.4% 199634 131396 65.8 10.8
Jan97 07933 1615 4338 13886 10.3 12271 122046 39.7% 202285 134317 66.4 10.4
Jan98 07069 1479 4090 12638 09.3 11159 124798 38.9% 204238 135951 66.6 09.3
Jan99 06604 1358 3645 11607 08.4 10249 127694 38.2% 206719 137943 66.7 08.5
Jan00 06316 1197 3355 10868 07.8 09671 129950 37.8% 208782 139621 66.9 07.8
Jan01 06647 1290 3559 11496 08.2 10206 130843 38.0% 210889 141049 66.9 08.1
Jan02 08935 1509 4249 14693 10.4 13184 127890 40.0% 213089 141074 66.2 10.5
Jan02 09051 1532 4453 15036 10.5 13504 129724 40.1% 216506 143228 66.2 10.5
Jan03 09395 1598 5003 15996 11.0 14398 130903 40.5% 219897 145301 66.1 11.0
Jan04 09144 1670 5152 15966 10.9 14296 131772 40.7% 222161 146068 65.7 10.9
Jan05 08444 1804 4793 15041 10.2 13237 133888 40.5% 224837 147125 65.4 10.2
Jan06 07608 1644 4513 13765 09.2 12122 136978 39.8% 227553 149090 65.5 09.2
Jan07 07649 1577 4620 13846 09.1 12269 139655 39.5% 230650 151924 65.9 09.1
Jan08 08221 1729 5235 15185 09.9 13456 139372 40.1% 232616 152828 65.7 09.9
Jan09 13009 2130 8675 23814 15.5 21684 131761 43.9% 234739 153445 65.4 15.4
Jan10 16147 2539 9161 27847 18.2 25308 127649 46.1% 236832 152957 64.6 18.0
Jan11 14937 2800 9027 26764 17.5 23964 128572 46.1% 238704 152536 63.9 17.3
Jan12 13541 2809 8747 25097 16.4 22288 131197 45.8% 242269 153485 63.4 16.2
Jan13 13181 2443 8506 24130 15.6 21687 133107 45.6% 244663 154794 63.3 15.4
Jan14 10855 2592 7617 21064 13.6 18472 135909 45.0% 246915 154381 62.5 13.5
Jan15 09498 2234 7125 1885
NOTIFY: Y | REPLY | REPLY WITH QUOTE | PERMALINK | TOP | HOME
Quote:
Originally posted by JEWELSTAITEFAN:
The shadowstats site is lean on actual data, requiring a subscription to access what it claims as database.
However, I will make attempt to add in some of the data it presents. This does make assumption that their methodology and counting methods are valid, which I cannot find clear information about.
There also may be comingling of Seasonally Adjusted figures from shadowstats without clarity, but this will be the only series of Tables I post which veer from Not Seasonally Adjusted figures.
The charts they present do show that Unemployment under Trump is better than any time under Obamanomics, so it may be a worthwhile endeavor to investigate.
I will refer to this set of data as Table JSF-URF-5
I will post some actual numbers and let the comparisons and discussion follow. The documented shenanigans of Obamabots deliberately refusing to Report jobless data in the months before the 2012 Election are a different matter, I will just use the Fake Data they produced and pretend it was real.
The 1st column of numbers is the unemployed. The 2nd column is the Rate.
The 3rd column is the sum of the Unemployed plus Marginally Attached plus Involuntary Part-time. 4th column is the Rate for column 3 figure. The Rates in columns 2 and 4 have the denominator of Labor Force.
The 5th column is the Civilian Population. 6th column is Labor Force, 7th column is Participation Rate. 8th column is the published U-6 figure.
The 9th column is the Real Unemployment figure, as presented by shadowstats. The 10th column is the underreported, the difference between the U-6 figure from BLS and the Real figure from shadowstats.
Figures in thousands.
MoYr Unem Pcnt Total Prcnt CivPop LbrForc Prtc% U6% Real Separation
Ja93 09911 07.9 16575 12.8 192644 126034 65.4
Ja94 09492 07.3 16575 12.8 195953 129393 66.0 12% 15.3% 2.3%
Ja95 08101 06.2 14504 11.1 197753 130698 66.1 10% 13.5% 3.5%
Ja96 08270 06.3 14110 10.7 199634 131396 65.8 10.8% 13.5% 2.7%
Ja97 07933 05.9 13886 10.3 202285 134317 66.4 10.4% 13% 2.6%
Ja98 07069 05.2 12638 09.3 204238 135951 66.6 09.3% 12% 2.7%
Ja99 06604 04.8 11607 08.4 206719 137943 66.7 08.5% 11.5% 3.0%
Ja00 06316 04.5 10868 07.8 208782 139621 66.9 07.8% 11% 3.2%
Ja01 06647 04.7 11496 08.2 210889 141049 66.9 08.1% 10.5% 2.4%
Ja02 08935 06.3 14693 10.4 213089 141074 66.2 10.5% 13% 2.5%
Ja02 09051 06.3 15036 10.5 216506 143228 66.2 10.5% 13% 2.5%
Ja03 09395 06.5 15996 11.0 219897 145301 66.1 11.0% 13% 2.0%
Ja04 09144 06.3 15966 10.9 222161 146068 65.7 10.9% 14% 3.1%
Ja05 08444 05.7 15041 10.2 224837 147125 65.4 10.2% 13% 2.8%
Ja06 07608 05.1 13765 09.2 227553 149090 65.5 09.2% 12% 2.8%
Ja07 07649 05.0 13846 09.1 230650 151924 65.9 09.1% 12% 2.9%
Ja08 08221 05.4 15185 09.9 232616 152828 65.7 09.9% 13% 3.1%
Ja09 13009 08.5 23814 15.5 234739 153445 65.4 15.4% 20% 4.6%
Ja10 16147 10.6 27847 18.2 236832 152957 64.6 18.0% 22% 4.0%
Ja11 14937 09.8 26764 17.5 238704 152536 63.9 17.3% 22.5% 5.2%
Ja12 13541 08.8 25097 16.4 242269 153485 63.4 16.2% 22.5% 6.3%
Ja13 13181 08.5 24130 15.6 244663 154794 63.3 15.4% 23% 7.6%
Ja14 10855 07.0 21064 13.6 246915 154381 62.5 13.5% 23.5% 10%
Ja15 09498 06.1 18857 12.1 249723 156050 62.5 12.0% 23.5% 11.5%
Ja16 08309 05.3 16632 10.6 252397 157347 62.3 10.5% 23% 12.5%
Ja17 08149 05.1 16028 10.1 254082 158676 62.5 10.1% 23% 12.9%
Ja18 07189 04.5 14222 08.9 256780 160037 62.3 08.9% 22% 13.1%
Ja19 07140 04.4 14297 08.8 258239 162104 62.8 08.8% 21.8% 13.0%
Ja20 06504 04.0 12573 07.7 259502 163497 63.0 07.7% 21.0% 13.3%
Ja21 10851 06.8 19188 12.1 260851 159234 61.0 12.0% 25.7% 13.7%
Ja22 07207 04.4 12924 07.9 263202 162825 61.9 07.9% 24
NOTIFY: Y | REPLY | REPLY WITH QUOTE | PERMALINK | TOP | HOME
This Table of Data, which breaks down the numerical changes in the key figures.
I will refer to this set of data as Table JSF-URF-6
I will post some actual numbers and let the comparisons and discussion follow.
The BLS uses both Seasonally Adjusted figures and Unadjusted figures, and interchanges them without clearly identifying so. I will use only the Unadjusted numbers, to help maintain clarity and transparency.
Some numbers may have a 0 placed as first digit, to maintain column form in this format.
The 1st column is Labor Force minus both Unemployed and Involuntary Part-Time. This is also Employed minus Involuntary Part-Time. This is not a figure identified by BLS, so I will call it Actually Fully Employed. This is Employed Full-time plus Voluntary Part-Time.
Not listed, but Civilian noninstitutional Population minus Actually Fully Employed is also a figure avoided by BLS, and I will call it Not Fully Employed, which is Unemployed plus Involuntary Part-Time plus Marginally Attached plus Not In Labor Force. The 2nd column is Not Fully Employed Rate, which is divided by Civilian noninstitutional Population.
The 3rd column is the Civilian Population. 4th column is Labor Force, 5th column is Participation Rate.
After the separation bar, the 7th column is the Increase in Civilian Population from the previous entry. For the entries by year, this is the 12 month Increase. For the entries broken down by month, this is the 1 month Increase.
The 8th column is the Increase in Labor Force from the previous entry.
The 9th column is the Increase in Actually Fully Employed count, from the previous entry.
In the monthly breakdown for 2018, after the second separation bar, the 10th column is the Civilian Population Increase from the entry 12 months prior.
The 11th column is the Labor Force Increase from the entry 12 months prior.
The 12th column is the Actually Fully Employed Increase from the entry 12 months prior.
The 13th column is the amount that the 12th column exceeds the 10th column, or the amount of Unemployed that is being chipped away, despite manipulation of other figures.
Figures in thousands.
Mo/Yr AcEmpl NtEm CiviPop LbrFrc Prtc% | CPIn LFIn AEInc
Jan94 114938 41.3% 195953 129393 66.0% |
Jan95 117923 40.4% 197753 130698 66.1% | 1800 1305 02985/+1185
Jan96 119023 40.4% 199634 131396 65.8% | 1881 0698 01100/-0781
Jan97 122046 39.7% 202285 134317 66.4% | 2651 2921 03023/+0372
Jan98 124798 38.9% 204238 135951 66.6% | 1953 1634 02752/+0799
Jan99 127694 38.2% 206719 137943 66.7% | 2481 1992 02896/+0415
Jan00 129950 37.8% 208782 139621 66.9% | 2063 1678 02256/+0193
Jan01 130843 38.0% 210889 141049 66.9% | 2107 1428 00893/-1214
Jan02 127890 40.0% 213089 141074 66.2% | 2200 0025 -2953/-5153
Jan02 129724 40.1% 216506 143228 66.2% | 5617 2179 -1119/-6736
Jan03 130903 40.5% 219897 145301 66.1% | 3391 2073 01179/-2212
Jan04 131772 40.7% 222161 146068 65.7% | 2264 0767 00869/-1395
Jan05 133888 40.5% 224837 147125 65.4% | 2676 1057 02116/-0560
Jan06 136978 39.8% 227553 149090 65.5% | 2716 1965 03090/+0374
Jan07 139655 39.5% 230650 151924 65.9% | 3097 2834 02677/-0420
Jan08 139372 40.1% 232616 152828 65.7% | 1966 0904 -0283/-2249
Jan09 131761 43.9% 234739 153445 65.4% | 2123 0617 -7611/-9734
Jan10 127649 46.1% 236832 152957 64.6% | 2093 -488 -4112/-6205
Jan11 128572 46.1% 238704 152536 63.9% | 1872 -421 00923/-0949
Jan12 131197 45.8% 242269 153485 63.4% | 3565 0949 02625/-0940
Jan13 133107 45.6% 244663 154794 63.3% | 2394 1309 01910/-0484
Jan14 135909 45.0% 246915 154381 62.5% | 2252 -413 02802/+0550
Jan15 139427 44.2% 249723 156050 62.5% | 2808 1669 03518/+0710
Jan16 1428
NOTIFY: Y | REPLY | REPLY WITH QUOTE | PERMALINK | TOP | HOME
Updating with Jobs Report data from yesterday (Friday, 7 October):
I will refer to this set of data as Table JSF-URF-1
Jan 2002 is listed twice. First with original report data from February 2002. Second with revised data from new Census data, published in February 2003.
Quote:
Originally posted by JEWELSTAITEFAN:
BLS currently defines the Want A Job category as not being part of the Labor Force.
So I will post some actual numbers and let the comparisons and discussion follow. The documented shenanigans of Obamabots deliberately refusing to Report jobless data in the months before the 2012 Election are a different matter, I will just use the Fake Data they produced and pretend it was real.
I will use only the Unadjusted numbers, to help maintain clarity and transparency.
Mo/Yr Unemp Pcnt WAJb Pcnt SubTtl Pcnt InvPT Pcnt Total Prcnt CivPop LbrFrc Prtc% U-6
Jan98 07069 05.2% 5026 3.7% 12095 08.9% 4090 3.0% 16185 11.9% 204238 135951 66.6 09.3
Jan99 06604 04.8% 4800 3.5% 11404 08.3% 3645 2.6% 15049 10.9% 206719 137943 66.7 08.5
Jan00 06316 04.5% 4354 3.1% 10670 07.6% 3355 2.4% 14025 10.0% 208782 139621 66.9 07.8
Jan01 06647 04.7% 4474 3.2% 11121 07.9% 3559 2.5% 14680 10.4% 210889 141049 66.9 08.1
Jan02 08935 06.3% 4872 3.5% 13807 09.8% 4249 3.0% 18056 12.8% 213089 141074 66.2 10.5
Jan02 09051 06.3% 4938 3.4% 13989 09.8% 4453 3.1% 18442 12.9% 216506 143228 66.2 10.5
Jan03 09395 06.5% 4779 3.3% 14174 09.8% 5003 3.4% 19177 13.2% 219897 145301 66.1 11.0
Jan04 09144 06.3% 4913 3.4% 14057 09.6% 5152 3.5% 19209 13.2% 222161 146068 65.7 10.9
Jan05 08444 05.7% 5136 3.5% 13580 09.2% 4793 3.3% 18373 12.5% 224837 147125 65.4 10.2
Jan06 07608 05.1% 5095 3.4% 12703 08.5% 4513 3.0% 17216 11.5% 227553 149090 65.5 09.2
Jan07 07649 05.0% 4633 3.0% 12282 08.1% 4620 3.0% 16902 11.1% 230650 151924 65.9 09.1
Jan08 08221 05.4% 4977 3.2% 13198 08.6% 5235 3.5% 18433 12.1% 232616 152828 65.7 09.9
Jan09 13009 08.5% 5866 3.8% 18875 12.3% 8675 5.7% 27550 18.0% 234739 153445 65.4 15.4
Jan10 16147 10.6% 6108 4.0% 22255 14.6% 9161 5.9% 31416 20.5% 236832 152957 64.6 18.0
Jan11 14937 09.8% 6643 4.3% 21580 14.1% 9027 6.0% 30607 20.1% 238704 152536 63.9 17.3
Jan12 13541 08.8% 6495 4.3% 20036 13.1% 8747 5.7% 28783 18.8% 242269 153485 63.4 16.2
Jan13 13181 08.5% 6781 4.4% 19962 12.9% 8506 5.5% 28468 18.4% 244663 154794 63.3 15.4
Jan14 10855 07.0% 6508 4.2% 17363 11.2% 7617 5.0% 24980 16.2% 246915 154381 62.5 13.5
Jan15 09498 06.1% 6467 4.1% 15965 10.2% 7125 4.6% 23090 14.8% 249723 156050 62.5 12.0
Jan16 08309 05.3% 6166 3.9% 14475 09.2% 6234 4.0% 20709 13.2% 252397 157347 62.3 10.5
Jan17 08149 05.1% 5934 3.8% 14083 08.9% 6127 3.8% 20210 12.7% 254082 158676 62.5 10.1
Jan18 07189 04.5% 5364 3.3% 12553 07.8% 5380 3.4% 17933 11.2% 256780 160037 62.3 08.9
Jan19 07140 04.4% 5435 3.4% 12575 07.8% 5543 3.4% 18118 11.2% 258239 162104 62.8 08.8
Jan20 06504 04.0% 5107 3.1% 11611 07.1% 4605 2.8% 16216 09.9% 259502 163497 63.0 07.7
Jan21 10851 06.8% 7129 4.5% 17980 11.3% 6284 3.9% 24264 15.2% 260851 159234 61.0 12.0
Jan22 07207 04.4
NOTIFY: Y | REPLY | REPLY WITH QUOTE | PERMALINK | TOP | HOME
Updating with today's Jobs Report to this Table of Data, which seems to best show the components of U6:
I will refer to this set of data as Table JSF-URF-2
Note: this year the Marginally Attached data is in Table A-16 of the report.
Quote:
I will post some actual numbers and let the comparisons and discussion follow. The documented shenanigans of Obamabots deliberately refusing to Report jobless data in the months before the 2012 Election are a different matter, I will just use the Fake Data they produced and pretend it was real.
The BLS uses both Seasonally Adjusted figures and Unadjusted figures, and interchanges them without clearly identifying so. For example, the current Rate of 4.1% (for 4 months straight) is SeasAdj, and the real Rate is 4.5% for Jan 2018. I will use only the Unadjusted numbers, to help maintain clarity and transparency.
Some numbers may have a 0 placed as first digit, to maintain column form in this format.
The 1st column of numbers is the unemployed. The 2nd column is the Rate.
The 3rd column is what is called Marginally Attached to the Labor Force, which is included in the Want A Job Now category but NOT included in the Labor Force category and therefore excluded from the reported Unemployment category. The 5th column is the sum of Unemployed plus Marginally Attached - which more accurately represents the Actual Unemployed. The 6th column is the Rate for column 5 figure.
The 7th column is the Involuntary Part-Time workers, who are Not Employed Full Time due to poor Economy, and want, are able to work FT. The 8th column is the Rate for column 7. The 9th column is the sum of the 5th column plus 7th column. 10th column is the Rate for column 9 figure. The Rates in columns 2, 4, 6, 8, 10 have the denominator of Labor Force.
The 11th column is the Civilian Population. 12th column is Labor Force, 13th column is Participation Rate. 14th column is the published U-6 figure.
Figures in thousands.
MoYr Unemp Pct MrgAt Pct SbTtl Pct InvPT Pct Total Pcnt CivPop LbrFrc Prtc% U6%
Ja93 09911 07.9 2120 1.6 11612 09.0 6181 4.9 16575 12.8 192644 126034 65.4
Ja94 09492 07.3 2120 1.6 11612 09.0 4963 3.8 16575 12.8 195953 129393 66.0
Ja95 08101 06.2 1783 1.4 09884 07.6 4620 3.5 14504 11.1 197753 130698 66.1
Ja96 08270 06.3 1737 1.3 10007 07.6 4103 3.1 14110 10.7 199634 131396 65.8 10.8
Ja97 07933 05.9 1615 1.2 09548 07.1 4338 3.2 13886 10.3 202285 134317 66.4 10.4
Ja98 07069 05.2 1479 1.1 08548 06.3 4090 3.0 12638 09.3 204238 135951 66.6 09.3
Ja99 06604 04.8 1358 1.0 07962 05.8 3645 2.6 11607 08.4 206719 137943 66.7 08.5
Ja00 06316 04.5 1197 0.9 07513 05.4 3355 2.4 10868 07.8 208782 139621 66.9 07.8
Ja01 06647 04.7 1290 0.9 07937 05.6 3559 2.5 11496 08.2 210889 141049 66.9 08.1
Ja02 08935 06.3 1509 1.1 10444 07.4 4249 3.0 14693 10.4 213089 141074 66.2 10.5
Ja02 09051 06.3 1532 1.1 10583 07.4 4453 3.1 15036 10.5 216506 143228 66.2 10.5
Ja03 09395 06.5 1598 1.1 10993 07.6 5003 3.4 15996 11.0 219897 145301 66.1 11.0
Ja04 09144 06.3 1670 1.1 10814 07.4 5152 3.5 15966 10.9 222161 146068 65.7 10.9
Ja05 08444 05.7 1804 1.2 10248 07.0 4793 3.3 15041 10.2 224837 147125 65.4 10.2
Ja06 07608 05.1 1644 1.1 09252 06.2 4513 3.0 13765 09.2 227553 149090 65.5 09.2
Ja07 07649 05.0 1577 1.0 09226 06.1 4620 3.0 13846 09.1 230650 151924 65.9 09.1
Ja08 08221 05.4 1729 1.1 09950 06.5 5235 3.4 15185 09.9 232616 152828 65.7 09.9
Ja09 13009 08.5 2130 1.4 15139 09.9 8675 5.6 23814 15.5 234739 153445 65.4 15.4
Ja10 16147 10.6 2539 1.6 18686 12.2 9161 6.0 27847 18.2 236832 152957 64.6 18.0
Ja11 14937 09.8 2800 1.8 17737 11.6 9027 5.9 26764 17.5 238704 152536 63.9 17.3
Ja12 13541 08.8 2809 1.9 16350 10.7 8747 5.7 25097 16.4 242269 153485 63.4 16.2
Ja13 13181 08.5 2443 1.6 15624 10.1 8506 5.5 24130 15.6 244663 154794 63.3 15.4
Ja14 10855 07.0 2592 1.7 13447 08.7 7617 4.9 2
NOTIFY: Y | REPLY | REPLY WITH QUOTE | PERMALINK | TOP | HOME
This Table of Data, which includes Not Fully Employed Rate.
I will refer to this set of data as Table JSF-URF-3
I will post some actual numbers and let the comparisons and discussion follow.
The BLS uses both Seasonally Adjusted figures and Unadjusted figures, and interchanges them without clearly identifying so. I will use only the Unadjusted numbers, to help maintain clarity and transparency.
Some numbers may have a 0 placed as first digit, to maintain column form in this format.
The 1st column of numbers is the Unemployed.
The 2nd column is what is called Marginally Attached to the Labor Force, which is included in the Want A Job Now category but NOT included in the Labor Force category and therefore excluded from the reported Unemployment category.
The 3rd column is the Involuntary Part-Time workers, who are Not Employed Full Time due to poor Economy, and want, are able to work FT. The 4th column of numbers is the sum of the 1st, 2nd, and 3rd columns. 5th column is the Rate for column 4 figure, divided by Labor Force.
The 6th column of numbers is the Subtotal of columns 1 and 3, Unemployed plus Involuntary Part-Time.
The 7th column is Labor Force minus column 6. This is also Employed minus column 3 Involuntary Part-Time. This is not a figure identified by BLS, so I will call it Actually Fully Employed. This is Employed Full-time plus Voluntary Part-Time.
Not listed, but Civilian noninstitutional Population minus Actually Fully Employed is also a figure avoided by BLS, and I will call it Not Fully Employed, which is Unemployed plus Involuntary Part-Time plus Marginally Attached plus Not In Labor Force. The 8th column is Not Fully Employed Rate, which is divided by Civilian noninstitutional Population.
The 9th column is the Civilian Population. 10th column is Labor Force, 11th column is Participation Rate. 12th column is the published U-6 figure.
Figures in thousands.
Mo/Yr Unem MrgAt InvPT Totl Prct SbTtl AcEmpl NotEm CivPop LbrForc Prtc% U6%
Jan94 09492 2120 4963 16575 12.8 14455 114938 41.3% 195953 129393 66.0
Jan95 08101 1783 4620 14504 11.1 12721 117923 40.4% 197753 130698 66.1
Jan96 08270 1737 4103 14110 10.7 12373 119023 40.4% 199634 131396 65.8 10.8
Jan97 07933 1615 4338 13886 10.3 12271 122046 39.7% 202285 134317 66.4 10.4
Jan98 07069 1479 4090 12638 09.3 11159 124798 38.9% 204238 135951 66.6 09.3
Jan99 06604 1358 3645 11607 08.4 10249 127694 38.2% 206719 137943 66.7 08.5
Jan00 06316 1197 3355 10868 07.8 09671 129950 37.8% 208782 139621 66.9 07.8
Jan01 06647 1290 3559 11496 08.2 10206 130843 38.0% 210889 141049 66.9 08.1
Jan02 08935 1509 4249 14693 10.4 13184 127890 40.0% 213089 141074 66.2 10.5
Jan02 09051 1532 4453 15036 10.5 13504 129724 40.1% 216506 143228 66.2 10.5
Jan03 09395 1598 5003 15996 11.0 14398 130903 40.5% 219897 145301 66.1 11.0
Jan04 09144 1670 5152 15966 10.9 14296 131772 40.7% 222161 146068 65.7 10.9
Jan05 08444 1804 4793 15041 10.2 13237 133888 40.5% 224837 147125 65.4 10.2
Jan06 07608 1644 4513 13765 09.2 12122 136978 39.8% 227553 149090 65.5 09.2
Jan07 07649 1577 4620 13846 09.1 12269 139655 39.5% 230650 151924 65.9 09.1
Jan08 08221 1729 5235 15185 09.9 13456 139372 40.1% 232616 152828 65.7 09.9
Jan09 13009 2130 8675 23814 15.5 21684 131761 43.9% 234739 153445 65.4 15.4
Jan10 16147 2539 9161 27847 18.2 25308 127649 46.1% 236832 152957 64.6 18.0
Jan11 14937 2800 9027 26764 17.5 23964 128572 46.1% 238704 152536 63.9 17.3
Jan12 13541 2809 8747 25097 16.4 22288 131197 45.8% 242269 153485 63.4 16.2
Jan13 13181 2443 8506 24130 15.6 21687 133107 45.6% 244663 154794 63.3 15.4
Jan14 10855 2592 7617 21064 13.6 18472 135909 45.0% 246915 154381 62.5 13.5
Jan15 09498 2234 7125 1885
NOTIFY: Y | REPLY | REPLY WITH QUOTE | PERMALINK | TOP | HOME
The shadowstats site is lean on actual data, requiring a subscription to access what it claims as database.
However, I will make attempt to add in some of the data it presents. This does make assumption that their methodology and counting methods are valid, which I cannot find clear information about.
There also may be comingling of Seasonally Adjusted figures from shadowstats without clarity, but this will be the only series of Tables I post which veer from Not Seasonally Adjusted figures.
The charts they present do show that Unemployment under Trump is better than any time under Obamanomics, so it may be a worthwhile endeavor to investigate.
I will refer to this set of data as Table JSF-URF-5
I will post some actual numbers and let the comparisons and discussion follow. The documented shenanigans of Obamabots deliberately refusing to Report jobless data in the months before the 2012 Election are a different matter, I will just use the Fake Data they produced and pretend it was real.
The 1st column of numbers is the unemployed. The 2nd column is the Rate.
The 3rd column is the sum of the Unemployed plus Marginally Attached plus Involuntary Part-time. 4th column is the Rate for column 3 figure. The Rates in columns 2 and 4 have the denominator of Labor Force.
The 5th column is the Civilian Population. 6th column is Labor Force, 7th column is Participation Rate. 8th column is the published U-6 figure.
The 9th column is the Real Unemployment figure, as presented by shadowstats. The 10th column is the underreported, the difference between the U-6 figure from BLS and the Real figure from shadowstats.
Figures in thousands.
MoYr Unem Pcnt Total Prcnt CivPop LbrForc Prtc% U6% Real Separation
Ja93 09911 07.9 16575 12.8 192644 126034 65.4
Ja94 09492 07.3 16575 12.8 195953 129393 66.0 12% 15.3% 2.3%
Ja95 08101 06.2 14504 11.1 197753 130698 66.1 10% 13.5% 3.5%
Ja96 08270 06.3 14110 10.7 199634 131396 65.8 10.8% 13.5% 2.7%
Ja97 07933 05.9 13886 10.3 202285 134317 66.4 10.4% 13% 2.6%
Ja98 07069 05.2 12638 09.3 204238 135951 66.6 09.3% 12% 2.7%
Ja99 06604 04.8 11607 08.4 206719 137943 66.7 08.5% 11.5% 3.0%
Ja00 06316 04.5 10868 07.8 208782 139621 66.9 07.8% 11% 3.2%
Ja01 06647 04.7 11496 08.2 210889 141049 66.9 08.1% 10.5% 2.4%
Ja02 08935 06.3 14693 10.4 213089 141074 66.2 10.5% 13% 2.5%
Ja02 09051 06.3 15036 10.5 216506 143228 66.2 10.5% 13% 2.5%
Ja03 09395 06.5 15996 11.0 219897 145301 66.1 11.0% 13% 2.0%
Ja04 09144 06.3 15966 10.9 222161 146068 65.7 10.9% 14% 3.1%
Ja05 08444 05.7 15041 10.2 224837 147125 65.4 10.2% 13% 2.8%
Ja06 07608 05.1 13765 09.2 227553 149090 65.5 09.2% 12% 2.8%
Ja07 07649 05.0 13846 09.1 230650 151924 65.9 09.1% 12% 2.9%
Ja08 08221 05.4 15185 09.9 232616 152828 65.7 09.9% 13% 3.1%
Ja09 13009 08.5 23814 15.5 234739 153445 65.4 15.4% 20% 4.6%
Ja10 16147 10.6 27847 18.2 236832 152957 64.6 18.0% 22% 4.0%
Ja11 14937 09.8 26764 17.5 238704 152536 63.9 17.3% 22.5% 5.2%
Ja12 13541 08.8 25097 16.4 242269 153485 63.4 16.2% 22.5% 6.3%
Ja13 13181 08.5 24130 15.6 244663 154794 63.3 15.4% 23% 7.6%
Ja14 10855 07.0 21064 13.6 246915 154381 62.5 13.5% 23.5% 10%
Ja15 09498 06.1 18857 12.1 249723 156050 62.5 12.0% 23.5% 11.5%
Ja16 08309 05.3 16632 10.6 252397 157347 62.3 10.5% 23% 12.5%
Ja17 08149 05.1 16028 10.1 254082 158676 62.5 10.1% 23% 12.9%
Ja18 07189 04.5 14222 08.9 256780 160037 62.3 08.9% 22% 13.1%
Ja19 07140 04.4 14297 08.8 258239 162104 62.8 08.8% 21.8% 13.0%
Ja20 06504 04.0 12573 07.7 259502 163497 63.0 07.7% 21.0% 13.3%
Ja21 10851 06.8 19188 12.1 260851 159234 61.0 12.0% 25.7% 13.7%
Ja22 07207 04.4 12924 07.9 263202 162825 61.9 07.9% 24.5% 16.6%
Ja18 07189 04.5 14222 08.9 2567
NOTIFY: Y | REPLY | REPLY WITH QUOTE | PERMALINK | TOP | HOME
This Table of Data, which breaks down the numerical changes in the key figures.
I will refer to this set of data as Table JSF-URF-6
I will post some actual numbers and let the comparisons and discussion follow.
The BLS uses both Seasonally Adjusted figures and Unadjusted figures, and interchanges them without clearly identifying so. I will use only the Unadjusted numbers, to help maintain clarity and transparency.
Some numbers may have a 0 placed as first digit, to maintain column form in this format.
The 1st column is Labor Force minus both Unemployed and Involuntary Part-Time. This is also Employed minus Involuntary Part-Time. This is not a figure identified by BLS, so I will call it Actually Fully Employed. This is Employed Full-time plus Voluntary Part-Time.
Not listed, but Civilian noninstitutional Population minus Actually Fully Employed is also a figure avoided by BLS, and I will call it Not Fully Employed, which is Unemployed plus Involuntary Part-Time plus Marginally Attached plus Not In Labor Force. The 2nd column is Not Fully Employed Rate, which is divided by Civilian noninstitutional Population.
The 3rd column is the Civilian Population. 4th column is Labor Force, 5th column is Participation Rate.
After the separation bar, the 7th column is the Increase in Civilian Population from the previous entry. For the entries by year, this is the 12 month Increase. For the entries broken down by month, this is the 1 month Increase.
The 8th column is the Increase in Labor Force from the previous entry.
The 9th column is the Increase in Actually Fully Employed count, from the previous entry.
In the monthly breakdown for 2018, after the second separation bar, the 10th column is the Civilian Population Increase from the entry 12 months prior.
The 11th column is the Labor Force Increase from the entry 12 months prior.
The 12th column is the Actually Fully Employed Increase from the entry 12 months prior.
The 13th column is the amount that the 12th column exceeds the 10th column, or the amount of Unemployed that is being chipped away, despite manipulation of other figures.
Figures in thousands.
Mo/Yr AcEmpl NtEm CiviPop LbrFrc Prtc% | CPIn LFIn AEInc
Jan94 114938 41.3% 195953 129393 66.0% |
Jan95 117923 40.4% 197753 130698 66.1% | 1800 1305 02985/+1185
Jan96 119023 40.4% 199634 131396 65.8% | 1881 0698 01100/-0781
Jan97 122046 39.7% 202285 134317 66.4% | 2651 2921 03023/+0372
Jan98 124798 38.9% 204238 135951 66.6% | 1953 1634 02752/+0799
Jan99 127694 38.2% 206719 137943 66.7% | 2481 1992 02896/+0415
Jan00 129950 37.8% 208782 139621 66.9% | 2063 1678 02256/+0193
Jan01 130843 38.0% 210889 141049 66.9% | 2107 1428 00893/-1214
Jan02 127890 40.0% 213089 141074 66.2% | 2200 0025 -2953/-5153
Jan02 129724 40.1% 216506 143228 66.2% | 5617 2179 -1119/-6736
Jan03 130903 40.5% 219897 145301 66.1% | 3391 2073 01179/-2212
Jan04 131772 40.7% 222161 146068 65.7% | 2264 0767 00869/-1395
Jan05 133888 40.5% 224837 147125 65.4% | 2676 1057 02116/-0560
Jan06 136978 39.8% 227553 149090 65.5% | 2716 1965 03090/+0374
Jan07 139655 39.5% 230650 151924 65.9% | 3097 2834 02677/-0420
Jan08 139372 40.1% 232616 152828 65.7% | 1966 0904 -0283/-2249
Jan09 131761 43.9% 234739 153445 65.4% | 2123 0617 -7611/-9734
Jan10 127649 46.1% 236832 152957 64.6% | 2093 -488 -4112/-6205
Jan11 128572 46.1% 238704 152536 63.9% | 1872 -421 00923/-0949
Jan12 131197 45.8% 242269 153485 63.4% | 3565 0949 02625/-0940
Jan13 133107 45.6% 244663 154794 63.3% | 2394 1309 01910/-0484
Jan14 135909 45.0% 246915 154381 62.5% | 2252 -413 02802/+0550
Jan15 139427 44.2% 249723 156050 62.5% | 2808 1669 03518/+0710
Jan16 1428
NOTIFY: Y | REPLY | REPLY WITH QUOTE | PERMALINK | TOP | HOME
Quote:
Originally posted by MONOLITHICSTUPIDFCK:
This Table of Data, which breaks down the numerical changes in the key figures.
I will refer to this set of data as Table JSF-URF-6
I will post some actual numbers and let the comparisons and discussion follow.
The BLS uses both Seasonally Adjusted figures and Unadjusted figures, and interchanges them without clearly identifying so. I will use only the Unadjusted numbers, to help maintain clarity and transparency.
Some numbers may have a 0 placed as first digit, to maintain column form in this format.
The 1st column is Labor Force minus both Unemployed and Involuntary Part-Time. This is also Employed minus Involuntary Part-Time. This is not a figure identified by BLS, so I will call it Actually Fully Employed. This is Employed Full-time plus Voluntary Part-Time.
Not listed, but Civilian noninstitutional Population minus Actually Fully Employed is also a figure avoided by BLS, and I will call it Not Fully Employed, which is Unemployed plus Involuntary Part-Time plus Marginally Attached plus Not In Labor Force. The 2nd column is Not Fully Employed Rate, which is divided by Civilian noninstitutional Population.
The 3rd column is the Civilian Population. 4th column is Labor Force, 5th column is Participation Rate.
After the separation bar, the 7th column is the Increase in Civilian Population from the previous entry. For the entries by year, this is the 12 month Increase. For the entries broken down by month, this is the 1 month Increase.
The 8th column is the Increase in Labor Force from the previous entry.
The 9th column is the Increase in Actually Fully Employed count, from the previous entry.
In the monthly breakdown for 2018, after the second separation bar, the 10th column is the Civilian Population Increase from the entry 12 months prior.
The 11th column is the Labor Force Increase from the entry 12 months prior.
The 12th column is the Actually Fully Employed Increase from the entry 12 months prior.
The 13th column is the amount that the 12th column exceeds the 10th column, or the amount of Unemployed that is being chipped away, despite manipulation of other figures.
Figures in thousands.
Mo/Yr AcEmpl NtEm CiviPop LbrFrc Prtc% | CPIn LFIn AEInc
Jan94 114938 41.3% 195953 129393 66.0% |
Jan95 117923 40.4% 197753 130698 66.1% | 1800 1305 02985/+1185
Jan96 119023 40.4% 199634 131396 65.8% | 1881 0698 01100/-0781
Jan97 122046 39.7% 202285 134317 66.4% | 2651 2921 03023/+0372
Jan98 124798 38.9% 204238 135951 66.6% | 1953 1634 02752/+0799
Jan99 127694 38.2% 206719 137943 66.7% | 2481 1992 02896/+0415
Jan00 129950 37.8% 208782 139621 66.9% | 2063 1678 02256/+0193
Jan01 130843 38.0% 210889 141049 66.9% | 2107 1428 00893/-1214
Jan02 127890 40.0% 213089 141074 66.2% | 2200 0025 -2953/-5153
Jan02 129724 40.1% 216506 143228 66.2% | 5617 2179 -1119/-6736
Jan03 130903 40.5% 219897 145301 66.1% | 3391 2073 01179/-2212
Jan04 131772 40.7% 222161 146068 65.7% | 2264 0767 00869/-1395
Jan05 133888 40.5% 224837 147125 65.4% | 2676 1057 02116/-0560
Jan06 136978 39.8% 227553 149090 65.5% | 2716 1965 03090/+0374
Jan07 139655 39.5% 230650 151924 65.9% | 3097 2834 02677/-0420
Jan08 139372 40.1% 232616 152828 65.7% | 1966 0904 -0283/-2249
Jan09 131761 43.9% 234739 153445 65.4% | 2123 0617 -7611/-9734
Jan10 127649 46.1% 236832 152957 64.6% | 2093 -488 -4112/-6205
Jan11 128572 46.1% 238704 152536 63.9% | 1872 -421 00923/-0949
Jan12 131197 45.8% 242269 153485 63.4% | 3565 0949 02625/-0940
Jan13 133107 45.6% 244663 154794 63.3% | 2394 1309 01910/-0484
Jan14 135909 45.0% 246915 154381 62.5% | 2252 -413 02802/+0550
Jan15 139427 44.2% 24
NOTIFY: Y | REPLY | REPLY WITH QUOTE | PERMALINK | TOP | HOME
Updating with Jobs Report data from today:
I will refer to this set of data as Table JSF-URF-1
Jan 2002 is listed twice. First with original report data from February 2002. Second with revised data from new Census data, published in February 2003.
Quote:
Originally posted by JEWELSTAITEFAN:
BLS currently defines the Want A Job category as not being part of the Labor Force.
So I will post some actual numbers and let the comparisons and discussion follow. The documented shenanigans of Obamabots deliberately refusing to Report jobless data in the months before the 2012 Election are a different matter, I will just use the Fake Data they produced and pretend it was real.
I will use only the Unadjusted numbers, to help maintain clarity and transparency.
Mo/Yr Unemp Pcnt WAJb Pcnt SubTtl Pcnt InvPT Pcnt Total Prcnt CivPop LbrFrc Prtc% U-6
Jan98 07069 05.2% 5026 3.7% 12095 08.9% 4090 3.0% 16185 11.9% 204238 135951 66.6 09.3
Jan99 06604 04.8% 4800 3.5% 11404 08.3% 3645 2.6% 15049 10.9% 206719 137943 66.7 08.5
Jan00 06316 04.5% 4354 3.1% 10670 07.6% 3355 2.4% 14025 10.0% 208782 139621 66.9 07.8
Jan01 06647 04.7% 4474 3.2% 11121 07.9% 3559 2.5% 14680 10.4% 210889 141049 66.9 08.1
Jan02 08935 06.3% 4872 3.5% 13807 09.8% 4249 3.0% 18056 12.8% 213089 141074 66.2 10.5
Jan02 09051 06.3% 4938 3.4% 13989 09.8% 4453 3.1% 18442 12.9% 216506 143228 66.2 10.5
Jan03 09395 06.5% 4779 3.3% 14174 09.8% 5003 3.4% 19177 13.2% 219897 145301 66.1 11.0
Jan04 09144 06.3% 4913 3.4% 14057 09.6% 5152 3.5% 19209 13.2% 222161 146068 65.7 10.9
Jan05 08444 05.7% 5136 3.5% 13580 09.2% 4793 3.3% 18373 12.5% 224837 147125 65.4 10.2
Jan06 07608 05.1% 5095 3.4% 12703 08.5% 4513 3.0% 17216 11.5% 227553 149090 65.5 09.2
Jan07 07649 05.0% 4633 3.0% 12282 08.1% 4620 3.0% 16902 11.1% 230650 151924 65.9 09.1
Jan08 08221 05.4% 4977 3.2% 13198 08.6% 5235 3.5% 18433 12.1% 232616 152828 65.7 09.9
Jan09 13009 08.5% 5866 3.8% 18875 12.3% 8675 5.7% 27550 18.0% 234739 153445 65.4 15.4
Jan10 16147 10.6% 6108 4.0% 22255 14.6% 9161 5.9% 31416 20.5% 236832 152957 64.6 18.0
Jan11 14937 09.8% 6643 4.3% 21580 14.1% 9027 6.0% 30607 20.1% 238704 152536 63.9 17.3
Jan12 13541 08.8% 6495 4.3% 20036 13.1% 8747 5.7% 28783 18.8% 242269 153485 63.4 16.2
Jan13 13181 08.5% 6781 4.4% 19962 12.9% 8506 5.5% 28468 18.4% 244663 154794 63.3 15.4
Jan14 10855 07.0% 6508 4.2% 17363 11.2% 7617 5.0% 24980 16.2% 246915 154381 62.5 13.5
Jan15 09498 06.1% 6467 4.1% 15965 10.2% 7125 4.6% 23090 14.8% 249723 156050 62.5 12.0
Jan16 08309 05.3% 6166 3.9% 14475 09.2% 6234 4.0% 20709 13.2% 252397 157347 62.3 10.5
Jan17 08149 05.1% 5934 3.8% 14083 08.9% 6127 3.8% 20210 12.7% 254082 158676 62.5 10.1
Jan18 07189 04.5% 5364 3.3% 12553 07.8% 5380 3.4% 17933 11.2% 256780 160037 62.3 08.9
Jan19 07140 04.4% 5435 3.4% 12575 07.8% 5543 3.4% 18118 11.2% 258239 162104 62.8 08.8
Jan20 06504 04.0% 5107 3.1% 11611 07.1% 4605 2.8% 16216 09.9% 259502 163497 63.0 07.7
Jan21 10851 06.8% 7129 4.5% 17980 11.3% 6284 3.9% 24264 15.2% 260851 159234 61.0 12.0
Jan22 07207 04.4% 5872 3.6% 13079 08.0%
NOTIFY: Y | REPLY | REPLY WITH QUOTE | PERMALINK | TOP | HOME
Updating with today's Jobs Report to this Table of Data, which seems to best show the components of U6:
I will refer to this set of data as Table JSF-URF-2
Note: this year the Marginally Attached data is in Table A-16 of the report.
Quote:
I will post some actual numbers and let the comparisons and discussion follow. The documented shenanigans of Obamabots deliberately refusing to Report jobless data in the months before the 2012 Election are a different matter, I will just use the Fake Data they produced and pretend it was real.
The BLS uses both Seasonally Adjusted figures and Unadjusted figures, and interchanges them without clearly identifying so. For example, the current Rate of 4.1% (for 4 months straight) is SeasAdj, and the real Rate is 4.5% for Jan 2018. I will use only the Unadjusted numbers, to help maintain clarity and transparency.
Some numbers may have a 0 placed as first digit, to maintain column form in this format.
The 1st column of numbers is the unemployed. The 2nd column is the Rate.
The 3rd column is what is called Marginally Attached to the Labor Force, which is included in the Want A Job Now category but NOT included in the Labor Force category and therefore excluded from the reported Unemployment category. The 5th column is the sum of Unemployed plus Marginally Attached - which more accurately represents the Actual Unemployed. The 6th column is the Rate for column 5 figure.
The 7th column is the Involuntary Part-Time workers, who are Not Employed Full Time due to poor Economy, and want, are able to work FT. The 8th column is the Rate for column 7. The 9th column is the sum of the 5th column plus 7th column. 10th column is the Rate for column 9 figure. The Rates in columns 2, 4, 6, 8, 10 have the denominator of Labor Force.
The 11th column is the Civilian Population. 12th column is Labor Force, 13th column is Participation Rate. 14th column is the published U-6 figure.
Figures in thousands.
MoYr Unemp Pct MrgAt Pct SbTtl Pct InvPT Pct Total Pcnt CivPop LbrFrc Prtc% U6%
Ja93 09911 07.9 2120 1.6 11612 09.0 6181 4.9 16575 12.8 192644 126034 65.4
Ja94 09492 07.3 2120 1.6 11612 09.0 4963 3.8 16575 12.8 195953 129393 66.0
Ja95 08101 06.2 1783 1.4 09884 07.6 4620 3.5 14504 11.1 197753 130698 66.1
Ja96 08270 06.3 1737 1.3 10007 07.6 4103 3.1 14110 10.7 199634 131396 65.8 10.8
Ja97 07933 05.9 1615 1.2 09548 07.1 4338 3.2 13886 10.3 202285 134317 66.4 10.4
Ja98 07069 05.2 1479 1.1 08548 06.3 4090 3.0 12638 09.3 204238 135951 66.6 09.3
Ja99 06604 04.8 1358 1.0 07962 05.8 3645 2.6 11607 08.4 206719 137943 66.7 08.5
Ja00 06316 04.5 1197 0.9 07513 05.4 3355 2.4 10868 07.8 208782 139621 66.9 07.8
Ja01 06647 04.7 1290 0.9 07937 05.6 3559 2.5 11496 08.2 210889 141049 66.9 08.1
Ja02 08935 06.3 1509 1.1 10444 07.4 4249 3.0 14693 10.4 213089 141074 66.2 10.5
Ja02 09051 06.3 1532 1.1 10583 07.4 4453 3.1 15036 10.5 216506 143228 66.2 10.5
Ja03 09395 06.5 1598 1.1 10993 07.6 5003 3.4 15996 11.0 219897 145301 66.1 11.0
Ja04 09144 06.3 1670 1.1 10814 07.4 5152 3.5 15966 10.9 222161 146068 65.7 10.9
Ja05 08444 05.7 1804 1.2 10248 07.0 4793 3.3 15041 10.2 224837 147125 65.4 10.2
Ja06 07608 05.1 1644 1.1 09252 06.2 4513 3.0 13765 09.2 227553 149090 65.5 09.2
Ja07 07649 05.0 1577 1.0 09226 06.1 4620 3.0 13846 09.1 230650 151924 65.9 09.1
Ja08 08221 05.4 1729 1.1 09950 06.5 5235 3.4 15185 09.9 232616 152828 65.7 09.9
Ja09 13009 08.5 2130 1.4 15139 09.9 8675 5.6 23814 15.5 234739 153445 65.4 15.4
Ja10 16147 10.6 2539 1.6 18686 12.2 9161 6.0 27847 18.2 236832 152957 64.6 18.0
Ja11 14937 09.8 2800 1.8 17737 11.6 9027 5.9 26764 17.5 238704 152536 63.9 17.3
Ja12 13541 08.8 2809 1.9 16350 10.7 8747 5.7 25097 16.4 242269 153485 63.4 16.2
Ja13 13181 08.5 2443 1.6 15624 10.1 8506 5.5 24130 15.6 244663 154794 63.3 15.4
Ja14 10855 07.0 2592 1.7 13447 08.7 7617 4.9 2
NOTIFY: Y | REPLY | REPLY WITH QUOTE | PERMALINK | TOP | HOME
This Table of Data, which includes Not Fully Employed Rate.
I will refer to this set of data as Table JSF-URF-3
I will post some actual numbers and let the comparisons and discussion follow.
The BLS uses both Seasonally Adjusted figures and Unadjusted figures, and interchanges them without clearly identifying so. I will use only the Unadjusted numbers, to help maintain clarity and transparency.
Some numbers may have a 0 placed as first digit, to maintain column form in this format.
The 1st column of numbers is the Unemployed.
The 2nd column is what is called Marginally Attached to the Labor Force, which is included in the Want A Job Now category but NOT included in the Labor Force category and therefore excluded from the reported Unemployment category.
The 3rd column is the Involuntary Part-Time workers, who are Not Employed Full Time due to poor Economy, and want, are able to work FT. The 4th column of numbers is the sum of the 1st, 2nd, and 3rd columns. 5th column is the Rate for column 4 figure, divided by Labor Force.
The 6th column of numbers is the Subtotal of columns 1 and 3, Unemployed plus Involuntary Part-Time.
The 7th column is Labor Force minus column 6. This is also Employed minus column 3 Involuntary Part-Time. This is not a figure identified by BLS, so I will call it Actually Fully Employed. This is Employed Full-time plus Voluntary Part-Time.
Not listed, but Civilian noninstitutional Population minus Actually Fully Employed is also a figure avoided by BLS, and I will call it Not Fully Employed, which is Unemployed plus Involuntary Part-Time plus Marginally Attached plus Not In Labor Force. The 8th column is Not Fully Employed Rate, which is divided by Civilian noninstitutional Population.
The 9th column is the Civilian Population. 10th column is Labor Force, 11th column is Participation Rate. 12th column is the published U-6 figure.
Figures in thousands.
Mo/Yr Unem MrgAt InvPT Totl Prct SbTtl AcEmpl NotEm CivPop LbrForc Prtc% U6%
Jan94 09492 2120 4963 16575 12.8 14455 114938 41.3% 195953 129393 66.0
Jan95 08101 1783 4620 14504 11.1 12721 117923 40.4% 197753 130698 66.1
Jan96 08270 1737 4103 14110 10.7 12373 119023 40.4% 199634 131396 65.8 10.8
Jan97 07933 1615 4338 13886 10.3 12271 122046 39.7% 202285 134317 66.4 10.4
Jan98 07069 1479 4090 12638 09.3 11159 124798 38.9% 204238 135951 66.6 09.3
Jan99 06604 1358 3645 11607 08.4 10249 127694 38.2% 206719 137943 66.7 08.5
Jan00 06316 1197 3355 10868 07.8 09671 129950 37.8% 208782 139621 66.9 07.8
Jan01 06647 1290 3559 11496 08.2 10206 130843 38.0% 210889 141049 66.9 08.1
Jan02 08935 1509 4249 14693 10.4 13184 127890 40.0% 213089 141074 66.2 10.5
Jan02 09051 1532 4453 15036 10.5 13504 129724 40.1% 216506 143228 66.2 10.5
Jan03 09395 1598 5003 15996 11.0 14398 130903 40.5% 219897 145301 66.1 11.0
Jan04 09144 1670 5152 15966 10.9 14296 131772 40.7% 222161 146068 65.7 10.9
Jan05 08444 1804 4793 15041 10.2 13237 133888 40.5% 224837 147125 65.4 10.2
Jan06 07608 1644 4513 13765 09.2 12122 136978 39.8% 227553 149090 65.5 09.2
Jan07 07649 1577 4620 13846 09.1 12269 139655 39.5% 230650 151924 65.9 09.1
Jan08 08221 1729 5235 15185 09.9 13456 139372 40.1% 232616 152828 65.7 09.9
Jan09 13009 2130 8675 23814 15.5 21684 131761 43.9% 234739 153445 65.4 15.4
Jan10 16147 2539 9161 27847 18.2 25308 127649 46.1% 236832 152957 64.6 18.0
Jan11 14937 2800 9027 26764 17.5 23964 128572 46.1% 238704 152536 63.9 17.3
Jan12 13541 2809 8747 25097 16.4 22288 131197 45.8% 242269 153485 63.4 16.2
Jan13 13181 2443 8506 24130 15.6 21687 133107 45.6% 244663 154794 63.3 15.4
Jan14 10855 2592 7617 21064 13.6 18472 135909 45.0% 246915 154381 62.5 13.5
Jan15 09498 2234 7125 1885
NOTIFY: Y | REPLY | REPLY WITH QUOTE | PERMALINK | TOP | HOME
The shadowstats site is lean on actual data, requiring a subscription to access what it claims as database.
However, I will make attempt to add in some of the data it presents. This does make assumption that their methodology and counting methods are valid, which I cannot find clear information about.
There also may be comingling of Seasonally Adjusted figures from shadowstats without clarity, but this will be the only series of Tables I post which veer from Not Seasonally Adjusted figures.
The charts they present do show that Unemployment under Trump is better than any time under Obamanomics, so it may be a worthwhile endeavor to investigate.
I will refer to this set of data as Table JSF-URF-5
I will post some actual numbers and let the comparisons and discussion follow. The documented shenanigans of Obamabots deliberately refusing to Report jobless data in the months before the 2012 Election are a different matter, I will just use the Fake Data they produced and pretend it was real.
The 1st column of numbers is the unemployed. The 2nd column is the Rate.
The 3rd column is the sum of the Unemployed plus Marginally Attached plus Involuntary Part-time. 4th column is the Rate for column 3 figure. The Rates in columns 2 and 4 have the denominator of Labor Force.
The 5th column is the Civilian Population. 6th column is Labor Force, 7th column is Participation Rate. 8th column is the published U-6 figure.
The 9th column is the Real Unemployment figure, as presented by shadowstats. The 10th column is the underreported, the difference between the U-6 figure from BLS and the Real figure from shadowstats.
Figures in thousands.
MoYr Unem Pcnt Total Prcnt CivPop LbrForc Prtc% U6% Real Separation
Ja93 09911 07.9 16575 12.8 192644 126034 65.4
Ja94 09492 07.3 16575 12.8 195953 129393 66.0 12% 15.3% 2.3%
Ja95 08101 06.2 14504 11.1 197753 130698 66.1 10% 13.5% 3.5%
Ja96 08270 06.3 14110 10.7 199634 131396 65.8 10.8% 13.5% 2.7%
Ja97 07933 05.9 13886 10.3 202285 134317 66.4 10.4% 13% 2.6%
Ja98 07069 05.2 12638 09.3 204238 135951 66.6 09.3% 12% 2.7%
Ja99 06604 04.8 11607 08.4 206719 137943 66.7 08.5% 11.5% 3.0%
Ja00 06316 04.5 10868 07.8 208782 139621 66.9 07.8% 11% 3.2%
Ja01 06647 04.7 11496 08.2 210889 141049 66.9 08.1% 10.5% 2.4%
Ja02 08935 06.3 14693 10.4 213089 141074 66.2 10.5% 13% 2.5%
Ja02 09051 06.3 15036 10.5 216506 143228 66.2 10.5% 13% 2.5%
Ja03 09395 06.5 15996 11.0 219897 145301 66.1 11.0% 13% 2.0%
Ja04 09144 06.3 15966 10.9 222161 146068 65.7 10.9% 14% 3.1%
Ja05 08444 05.7 15041 10.2 224837 147125 65.4 10.2% 13% 2.8%
Ja06 07608 05.1 13765 09.2 227553 149090 65.5 09.2% 12% 2.8%
Ja07 07649 05.0 13846 09.1 230650 151924 65.9 09.1% 12% 2.9%
Ja08 08221 05.4 15185 09.9 232616 152828 65.7 09.9% 13% 3.1%
Ja09 13009 08.5 23814 15.5 234739 153445 65.4 15.4% 20% 4.6%
Ja10 16147 10.6 27847 18.2 236832 152957 64.6 18.0% 22% 4.0%
Ja11 14937 09.8 26764 17.5 238704 152536 63.9 17.3% 22.5% 5.2%
Ja12 13541 08.8 25097 16.4 242269 153485 63.4 16.2% 22.5% 6.3%
Ja13 13181 08.5 24130 15.6 244663 154794 63.3 15.4% 23% 7.6%
Ja14 10855 07.0 21064 13.6 246915 154381 62.5 13.5% 23.5% 10%
Ja15 09498 06.1 18857 12.1 249723 156050 62.5 12.0% 23.5% 11.5%
Ja16 08309 05.3 16632 10.6 252397 157347 62.3 10.5% 23% 12.5%
Ja17 08149 05.1 16028 10.1 254082 158676 62.5 10.1% 23% 12.9%
Ja18 07189 04.5 14222 08.9 256780 160037 62.3 08.9% 22% 13.1%
Ja19 07140 04.4 14297 08.8 258239 162104 62.8 08.8% 21.8% 13.0%
Ja20 06504 04.0 12573 07.7 259502 163497 63.0 07.7% 21.0% 13.3%
Ja21 10851 06.8 19188 12.1 260851 159234 61.0 12.0% 25.7% 13.7%
Ja22 07207 04.4 12924 07.9 263202 162825 61.9 07.9% 24.5% 16.6%
Ja18 07189 04.5 14222 08.9 2567
NOTIFY: Y | REPLY | REPLY WITH QUOTE | PERMALINK | TOP | HOME
This Table of Data, which breaks down the numerical changes in the key figures.
I will refer to this set of data as Table JSF-URF-6
I will post some actual numbers and let the comparisons and discussion follow.
The BLS uses both Seasonally Adjusted figures and Unadjusted figures, and interchanges them without clearly identifying so. I will use only the Unadjusted numbers, to help maintain clarity and transparency.
Some numbers may have a 0 placed as first digit, to maintain column form in this format.
The 1st column is Labor Force minus both Unemployed and Involuntary Part-Time. This is also Employed minus Involuntary Part-Time. This is not a figure identified by BLS, so I will call it Actually Fully Employed. This is Employed Full-time plus Voluntary Part-Time.
Not listed, but Civilian noninstitutional Population minus Actually Fully Employed is also a figure avoided by BLS, and I will call it Not Fully Employed, which is Unemployed plus Involuntary Part-Time plus Marginally Attached plus Not In Labor Force. The 2nd column is Not Fully Employed Rate, which is divided by Civilian noninstitutional Population.
The 3rd column is the Civilian Population. 4th column is Labor Force, 5th column is Participation Rate.
After the separation bar, the 7th column is the Increase in Civilian Population from the previous entry. For the entries by year, this is the 12 month Increase. For the entries broken down by month, this is the 1 month Increase.
The 8th column is the Increase in Labor Force from the previous entry.
The 9th column is the Increase in Actually Fully Employed count, from the previous entry.
In the monthly breakdown for 2018, after the second separation bar, the 10th column is the Civilian Population Increase from the entry 12 months prior.
The 11th column is the Labor Force Increase from the entry 12 months prior.
The 12th column is the Actually Fully Employed Increase from the entry 12 months prior.
The 13th column is the amount that the 12th column exceeds the 10th column, or the amount of Unemployed that is being chipped away, despite manipulation of other figures.
Figures in thousands.
Mo/Yr AcEmpl NtEm CiviPop LbrFrc Prtc% | CPIn LFIn AEInc
Jan94 114938 41.3% 195953 129393 66.0% |
Jan95 117923 40.4% 197753 130698 66.1% | 1800 1305 02985/+1185
Jan96 119023 40.4% 199634 131396 65.8% | 1881 0698 01100/-0781
Jan97 122046 39.7% 202285 134317 66.4% | 2651 2921 03023/+0372
Jan98 124798 38.9% 204238 135951 66.6% | 1953 1634 02752/+0799
Jan99 127694 38.2% 206719 137943 66.7% | 2481 1992 02896/+0415
Jan00 129950 37.8% 208782 139621 66.9% | 2063 1678 02256/+0193
Jan01 130843 38.0% 210889 141049 66.9% | 2107 1428 00893/-1214
Jan02 127890 40.0% 213089 141074 66.2% | 2200 0025 -2953/-5153
Jan02 129724 40.1% 216506 143228 66.2% | 5617 2179 -1119/-6736
Jan03 130903 40.5% 219897 145301 66.1% | 3391 2073 01179/-2212
Jan04 131772 40.7% 222161 146068 65.7% | 2264 0767 00869/-1395
Jan05 133888 40.5% 224837 147125 65.4% | 2676 1057 02116/-0560
Jan06 136978 39.8% 227553 149090 65.5% | 2716 1965 03090/+0374
Jan07 139655 39.5% 230650 151924 65.9% | 3097 2834 02677/-0420
Jan08 139372 40.1% 232616 152828 65.7% | 1966 0904 -0283/-2249
Jan09 131761 43.9% 234739 153445 65.4% | 2123 0617 -7611/-9734
Jan10 127649 46.1% 236832 152957 64.6% | 2093 -488 -4112/-6205
Jan11 128572 46.1% 238704 152536 63.9% | 1872 -421 00923/-0949
Jan12 131197 45.8% 242269 153485 63.4% | 3565 0949 02625/-0940
Jan13 133107 45.6% 244663 154794 63.3% | 2394 1309 01910/-0484
Jan14 135909 45.0% 246915 154381 62.5% | 2252 -413 02802/+0550
Jan15 139427 44.2% 249723 156050 62.5% | 2808 1669 03518/+0710
Jan16 1428
NOTIFY: Y | REPLY | REPLY WITH QUOTE | PERMALINK | TOP | HOME
Updating with Jobs Report data from yesterday (Friday, 2 December):
I will refer to this set of data as Table JSF-URF-1
Jan 2002 is listed twice. First with original report data from February 2002. Second with revised data from new Census data, published in February 2003.
Quote:
Originally posted by JEWELSTAITEFAN:
BLS currently defines the Want A Job category as not being part of the Labor Force.
So I will post some actual numbers and let the comparisons and discussion follow. The documented shenanigans of Obamabots deliberately refusing to Report jobless data in the months before the 2012 Election are a different matter, I will just use the Fake Data they produced and pretend it was real.
I will use only the Unadjusted numbers, to help maintain clarity and transparency.
Mo/Yr Unemp Pcnt WAJb Pcnt SubTtl Pcnt InvPT Pcnt Total Prcnt CivPop LbrFrc Prtc% U-6
Jan98 07069 05.2% 5026 3.7% 12095 08.9% 4090 3.0% 16185 11.9% 204238 135951 66.6 09.3
Jan99 06604 04.8% 4800 3.5% 11404 08.3% 3645 2.6% 15049 10.9% 206719 137943 66.7 08.5
Jan00 06316 04.5% 4354 3.1% 10670 07.6% 3355 2.4% 14025 10.0% 208782 139621 66.9 07.8
Jan01 06647 04.7% 4474 3.2% 11121 07.9% 3559 2.5% 14680 10.4% 210889 141049 66.9 08.1
Jan02 08935 06.3% 4872 3.5% 13807 09.8% 4249 3.0% 18056 12.8% 213089 141074 66.2 10.5
Jan02 09051 06.3% 4938 3.4% 13989 09.8% 4453 3.1% 18442 12.9% 216506 143228 66.2 10.5
Jan03 09395 06.5% 4779 3.3% 14174 09.8% 5003 3.4% 19177 13.2% 219897 145301 66.1 11.0
Jan04 09144 06.3% 4913 3.4% 14057 09.6% 5152 3.5% 19209 13.2% 222161 146068 65.7 10.9
Jan05 08444 05.7% 5136 3.5% 13580 09.2% 4793 3.3% 18373 12.5% 224837 147125 65.4 10.2
Jan06 07608 05.1% 5095 3.4% 12703 08.5% 4513 3.0% 17216 11.5% 227553 149090 65.5 09.2
Jan07 07649 05.0% 4633 3.0% 12282 08.1% 4620 3.0% 16902 11.1% 230650 151924 65.9 09.1
Jan08 08221 05.4% 4977 3.2% 13198 08.6% 5235 3.5% 18433 12.1% 232616 152828 65.7 09.9
Jan09 13009 08.5% 5866 3.8% 18875 12.3% 8675 5.7% 27550 18.0% 234739 153445 65.4 15.4
Jan10 16147 10.6% 6108 4.0% 22255 14.6% 9161 5.9% 31416 20.5% 236832 152957 64.6 18.0
Jan11 14937 09.8% 6643 4.3% 21580 14.1% 9027 6.0% 30607 20.1% 238704 152536 63.9 17.3
Jan12 13541 08.8% 6495 4.3% 20036 13.1% 8747 5.7% 28783 18.8% 242269 153485 63.4 16.2
Jan13 13181 08.5% 6781 4.4% 19962 12.9% 8506 5.5% 28468 18.4% 244663 154794 63.3 15.4
Jan14 10855 07.0% 6508 4.2% 17363 11.2% 7617 5.0% 24980 16.2% 246915 154381 62.5 13.5
Jan15 09498 06.1% 6467 4.1% 15965 10.2% 7125 4.6% 23090 14.8% 249723 156050 62.5 12.0
Jan16 08309 05.3% 6166 3.9% 14475 09.2% 6234 4.0% 20709 13.2% 252397 157347 62.3 10.5
Jan17 08149 05.1% 5934 3.8% 14083 08.9% 6127 3.8% 20210 12.7% 254082 158676 62.5 10.1
Jan18 07189 04.5% 5364 3.3% 12553 07.8% 5380 3.4% 17933 11.2% 256780 160037 62.3 08.9
Jan19 07140 04.4% 5435 3.4% 12575 07.8% 5543 3.4% 18118 11.2% 258239 162104 62.8 08.8
Jan20 06504 04.0% 5107 3.1% 11611 07.1% 4605 2.8% 16216 09.9% 259502 163497 63.0 07.7
Jan21 10851 06.8% 7129 4.5% 17980 11.3% 6284 3.9% 24264 15.2% 260851 159234 61.0 12.0
Jan22 07207 04.
NOTIFY: Y | REPLY | REPLY WITH QUOTE | PERMALINK | TOP | HOME
Updating with today's Jobs Report to this Table of Data, which seems to best show the components of U6:
I will refer to this set of data as Table JSF-URF-2
Note: this year the Marginally Attached data is in Table A-16 of the report.
Quote:
I will post some actual numbers and let the comparisons and discussion follow. The documented shenanigans of Obamabots deliberately refusing to Report jobless data in the months before the 2012 Election are a different matter, I will just use the Fake Data they produced and pretend it was real.
The BLS uses both Seasonally Adjusted figures and Unadjusted figures, and interchanges them without clearly identifying so. For example, the current Rate of 4.1% (for 4 months straight) is SeasAdj, and the real Rate is 4.5% for Jan 2018. I will use only the Unadjusted numbers, to help maintain clarity and transparency.
Some numbers may have a 0 placed as first digit, to maintain column form in this format.
The 1st column of numbers is the unemployed. The 2nd column is the Rate.
The 3rd column is what is called Marginally Attached to the Labor Force, which is included in the Want A Job Now category but NOT included in the Labor Force category and therefore excluded from the reported Unemployment category. The 5th column is the sum of Unemployed plus Marginally Attached - which more accurately represents the Actual Unemployed. The 6th column is the Rate for column 5 figure.
The 7th column is the Involuntary Part-Time workers, who are Not Employed Full Time due to poor Economy, and want, are able to work FT. The 8th column is the Rate for column 7. The 9th column is the sum of the 5th column plus 7th column. 10th column is the Rate for column 9 figure. The Rates in columns 2, 4, 6, 8, 10 have the denominator of Labor Force.
The 11th column is the Civilian Population. 12th column is Labor Force, 13th column is Participation Rate. 14th column is the published U-6 figure.
Figures in thousands.
MoYr Unemp Pct MrgAt Pct SbTtl Pct InvPT Pct Total Pcnt CivPop LbrFrc Prtc% U6%
Ja93 09911 07.9 2120 1.6 11612 09.0 6181 4.9 16575 12.8 192644 126034 65.4
Ja94 09492 07.3 2120 1.6 11612 09.0 4963 3.8 16575 12.8 195953 129393 66.0
Ja95 08101 06.2 1783 1.4 09884 07.6 4620 3.5 14504 11.1 197753 130698 66.1
Ja96 08270 06.3 1737 1.3 10007 07.6 4103 3.1 14110 10.7 199634 131396 65.8 10.8
Ja97 07933 05.9 1615 1.2 09548 07.1 4338 3.2 13886 10.3 202285 134317 66.4 10.4
Ja98 07069 05.2 1479 1.1 08548 06.3 4090 3.0 12638 09.3 204238 135951 66.6 09.3
Ja99 06604 04.8 1358 1.0 07962 05.8 3645 2.6 11607 08.4 206719 137943 66.7 08.5
Ja00 06316 04.5 1197 0.9 07513 05.4 3355 2.4 10868 07.8 208782 139621 66.9 07.8
Ja01 06647 04.7 1290 0.9 07937 05.6 3559 2.5 11496 08.2 210889 141049 66.9 08.1
Ja02 08935 06.3 1509 1.1 10444 07.4 4249 3.0 14693 10.4 213089 141074 66.2 10.5
Ja02 09051 06.3 1532 1.1 10583 07.4 4453 3.1 15036 10.5 216506 143228 66.2 10.5
Ja03 09395 06.5 1598 1.1 10993 07.6 5003 3.4 15996 11.0 219897 145301 66.1 11.0
Ja04 09144 06.3 1670 1.1 10814 07.4 5152 3.5 15966 10.9 222161 146068 65.7 10.9
Ja05 08444 05.7 1804 1.2 10248 07.0 4793 3.3 15041 10.2 224837 147125 65.4 10.2
Ja06 07608 05.1 1644 1.1 09252 06.2 4513 3.0 13765 09.2 227553 149090 65.5 09.2
Ja07 07649 05.0 1577 1.0 09226 06.1 4620 3.0 13846 09.1 230650 151924 65.9 09.1
Ja08 08221 05.4 1729 1.1 09950 06.5 5235 3.4 15185 09.9 232616 152828 65.7 09.9
Ja09 13009 08.5 2130 1.4 15139 09.9 8675 5.6 23814 15.5 234739 153445 65.4 15.4
Ja10 16147 10.6 2539 1.6 18686 12.2 9161 6.0 27847 18.2 236832 152957 64.6 18.0
Ja11 14937 09.8 2800 1.8 17737 11.6 9027 5.9 26764 17.5 238704 152536 63.9 17.3
Ja12 13541 08.8 2809 1.9 16350 10.7 8747 5.7 25097 16.4 242269 153485 63.4 16.2
Ja13 13181 08.5 2443 1.6 15624 10.1 8506 5.5 24130 15.6 244663 154794 63.3 15.4
Ja14 10855 07.0 2592 1.7 13447 08.7 7617 4.9 2
NOTIFY: Y | REPLY | REPLY WITH QUOTE | PERMALINK | TOP | HOME
This Table of Data, which includes Not Fully Employed Rate.
I will refer to this set of data as Table JSF-URF-3
I will post some actual numbers and let the comparisons and discussion follow.
The BLS uses both Seasonally Adjusted figures and Unadjusted figures, and interchanges them without clearly identifying so. I will use only the Unadjusted numbers, to help maintain clarity and transparency.
Some numbers may have a 0 placed as first digit, to maintain column form in this format.
The 1st column of numbers is the Unemployed.
The 2nd column is what is called Marginally Attached to the Labor Force, which is included in the Want A Job Now category but NOT included in the Labor Force category and therefore excluded from the reported Unemployment category.
The 3rd column is the Involuntary Part-Time workers, who are Not Employed Full Time due to poor Economy, and want, are able to work FT. The 4th column of numbers is the sum of the 1st, 2nd, and 3rd columns. 5th column is the Rate for column 4 figure, divided by Labor Force.
The 6th column of numbers is the Subtotal of columns 1 and 3, Unemployed plus Involuntary Part-Time.
The 7th column is Labor Force minus column 6. This is also Employed minus column 3 Involuntary Part-Time. This is not a figure identified by BLS, so I will call it Actually Fully Employed. This is Employed Full-time plus Voluntary Part-Time.
Not listed, but Civilian noninstitutional Population minus Actually Fully Employed is also a figure avoided by BLS, and I will call it Not Fully Employed, which is Unemployed plus Involuntary Part-Time plus Marginally Attached plus Not In Labor Force. The 8th column is Not Fully Employed Rate, which is divided by Civilian noninstitutional Population.
The 9th column is the Civilian Population. 10th column is Labor Force, 11th column is Participation Rate. 12th column is the published U-6 figure.
Figures in thousands.
Mo/Yr Unem MrgAt InvPT Totl Prct SbTtl AcEmpl NotEm CivPop LbrForc Prtc% U6%
Jan94 09492 2120 4963 16575 12.8 14455 114938 41.3% 195953 129393 66.0
Jan95 08101 1783 4620 14504 11.1 12721 117923 40.4% 197753 130698 66.1
Jan96 08270 1737 4103 14110 10.7 12373 119023 40.4% 199634 131396 65.8 10.8
Jan97 07933 1615 4338 13886 10.3 12271 122046 39.7% 202285 134317 66.4 10.4
Jan98 07069 1479 4090 12638 09.3 11159 124798 38.9% 204238 135951 66.6 09.3
Jan99 06604 1358 3645 11607 08.4 10249 127694 38.2% 206719 137943 66.7 08.5
Jan00 06316 1197 3355 10868 07.8 09671 129950 37.8% 208782 139621 66.9 07.8
Jan01 06647 1290 3559 11496 08.2 10206 130843 38.0% 210889 141049 66.9 08.1
Jan02 08935 1509 4249 14693 10.4 13184 127890 40.0% 213089 141074 66.2 10.5
Jan02 09051 1532 4453 15036 10.5 13504 129724 40.1% 216506 143228 66.2 10.5
Jan03 09395 1598 5003 15996 11.0 14398 130903 40.5% 219897 145301 66.1 11.0
Jan04 09144 1670 5152 15966 10.9 14296 131772 40.7% 222161 146068 65.7 10.9
Jan05 08444 1804 4793 15041 10.2 13237 133888 40.5% 224837 147125 65.4 10.2
Jan06 07608 1644 4513 13765 09.2 12122 136978 39.8% 227553 149090 65.5 09.2
Jan07 07649 1577 4620 13846 09.1 12269 139655 39.5% 230650 151924 65.9 09.1
Jan08 08221 1729 5235 15185 09.9 13456 139372 40.1% 232616 152828 65.7 09.9
Jan09 13009 2130 8675 23814 15.5 21684 131761 43.9% 234739 153445 65.4 15.4
Jan10 16147 2539 9161 27847 18.2 25308 127649 46.1% 236832 152957 64.6 18.0
Jan11 14937 2800 9027 26764 17.5 23964 128572 46.1% 238704 152536 63.9 17.3
Jan12 13541 2809 8747 25097 16.4 22288 131197 45.8% 242269 153485 63.4 16.2
Jan13 13181 2443 8506 24130 15.6 21687 133107 45.6% 244663 154794 63.3 15.4
Jan14 10855 2592 7617 21064 13.6 18472 135909 45.0% 246915 154381 62.5 13.5
Jan15 09498 2234 7125 1885
NOTIFY: Y | REPLY | REPLY WITH QUOTE | PERMALINK | TOP | HOME
Quote:
Originally posted by JEWELSTAITEFAN:
The shadowstats site is lean on actual data, requiring a subscription to access what it claims as database.
However, I will make attempt to add in some of the data it presents. This does make assumption that their methodology and counting methods are valid, which I cannot find clear information about.
There also may be comingling of Seasonally Adjusted figures from shadowstats without clarity, but this will be the only series of Tables I post which veer from Not Seasonally Adjusted figures.
The charts they present do show that Unemployment under Trump is better than any time under Obamanomics, so it may be a worthwhile endeavor to investigate.
I will refer to this set of data as Table JSF-URF-5
I will post some actual numbers and let the comparisons and discussion follow. The documented shenanigans of Obamabots deliberately refusing to Report jobless data in the months before the 2012 Election are a different matter, I will just use the Fake Data they produced and pretend it was real.
The 1st column of numbers is the unemployed. The 2nd column is the Rate.
The 3rd column is the sum of the Unemployed plus Marginally Attached plus Involuntary Part-time. 4th column is the Rate for column 3 figure. The Rates in columns 2 and 4 have the denominator of Labor Force.
The 5th column is the Civilian Population. 6th column is Labor Force, 7th column is Participation Rate. 8th column is the published U-6 figure.
The 9th column is the Real Unemployment figure, as presented by shadowstats. The 10th column is the underreported, the difference between the U-6 figure from BLS and the Real figure from shadowstats.
Figures in thousands.
MoYr Unem Pcnt Total Prcnt CivPop LbrForc Prtc% U6% Real Separation
Ja93 09911 07.9 16575 12.8 192644 126034 65.4
Ja94 09492 07.3 16575 12.8 195953 129393 66.0 12% 15.3% 2.3%
Ja95 08101 06.2 14504 11.1 197753 130698 66.1 10% 13.5% 3.5%
Ja96 08270 06.3 14110 10.7 199634 131396 65.8 10.8% 13.5% 2.7%
Ja97 07933 05.9 13886 10.3 202285 134317 66.4 10.4% 13% 2.6%
Ja98 07069 05.2 12638 09.3 204238 135951 66.6 09.3% 12% 2.7%
Ja99 06604 04.8 11607 08.4 206719 137943 66.7 08.5% 11.5% 3.0%
Ja00 06316 04.5 10868 07.8 208782 139621 66.9 07.8% 11% 3.2%
Ja01 06647 04.7 11496 08.2 210889 141049 66.9 08.1% 10.5% 2.4%
Ja02 08935 06.3 14693 10.4 213089 141074 66.2 10.5% 13% 2.5%
Ja02 09051 06.3 15036 10.5 216506 143228 66.2 10.5% 13% 2.5%
Ja03 09395 06.5 15996 11.0 219897 145301 66.1 11.0% 13% 2.0%
Ja04 09144 06.3 15966 10.9 222161 146068 65.7 10.9% 14% 3.1%
Ja05 08444 05.7 15041 10.2 224837 147125 65.4 10.2% 13% 2.8%
Ja06 07608 05.1 13765 09.2 227553 149090 65.5 09.2% 12% 2.8%
Ja07 07649 05.0 13846 09.1 230650 151924 65.9 09.1% 12% 2.9%
Ja08 08221 05.4 15185 09.9 232616 152828 65.7 09.9% 13% 3.1%
Ja09 13009 08.5 23814 15.5 234739 153445 65.4 15.4% 20% 4.6%
Ja10 16147 10.6 27847 18.2 236832 152957 64.6 18.0% 22% 4.0%
Ja11 14937 09.8 26764 17.5 238704 152536 63.9 17.3% 22.5% 5.2%
Ja12 13541 08.8 25097 16.4 242269 153485 63.4 16.2% 22.5% 6.3%
Ja13 13181 08.5 24130 15.6 244663 154794 63.3 15.4% 23% 7.6%
Ja14 10855 07.0 21064 13.6 246915 154381 62.5 13.5% 23.5% 10%
Ja15 09498 06.1 18857 12.1 249723 156050 62.5 12.0% 23.5% 11.5%
Ja16 08309 05.3 16632 10.6 252397 157347 62.3 10.5% 23% 12.5%
Ja17 08149 05.1 16028 10.1 254082 158676 62.5 10.1% 23% 12.9%
Ja18 07189 04.5 14222 08.9 256780 160037 62.3 08.9% 22% 13.1%
Ja19 07140 04.4 14297 08.8 258239 162104 62.8 08.8% 21.8% 13.0%
Ja20 06504 04.0 12573 07.7 259502 163497 63.0 07.7% 21.0% 13.3%
Ja21 10851 06.8 19188 12.1 260851 159234 61.0 12.0% 25.7% 13.7%
Ja22 07207 04.4 12924 07.9 263202 162825 61.9 07.9% 24.5
NOTIFY: Y | REPLY | REPLY WITH QUOTE | PERMALINK | TOP | HOME
This Table of Data, which breaks down the numerical changes in the key figures.
I will refer to this set of data as Table JSF-URF-6
I will post some actual numbers and let the comparisons and discussion follow.
The BLS uses both Seasonally Adjusted figures and Unadjusted figures, and interchanges them without clearly identifying so. I will use only the Unadjusted numbers, to help maintain clarity and transparency.
Some numbers may have a 0 placed as first digit, to maintain column form in this format.
The 1st column is Labor Force minus both Unemployed and Involuntary Part-Time. This is also Employed minus Involuntary Part-Time. This is not a figure identified by BLS, so I will call it Actually Fully Employed. This is Employed Full-time plus Voluntary Part-Time.
Not listed, but Civilian noninstitutional Population minus Actually Fully Employed is also a figure avoided by BLS, and I will call it Not Fully Employed, which is Unemployed plus Involuntary Part-Time plus Marginally Attached plus Not In Labor Force. The 2nd column is Not Fully Employed Rate, which is divided by Civilian noninstitutional Population.
The 3rd column is the Civilian Population. 4th column is Labor Force, 5th column is Participation Rate.
After the separation bar, the 7th column is the Increase in Civilian Population from the previous entry. For the entries by year, this is the 12 month Increase. For the entries broken down by month, this is the 1 month Increase.
The 8th column is the Increase in Labor Force from the previous entry.
The 9th column is the Increase in Actually Fully Employed count, from the previous entry.
In the monthly breakdown for 2018, after the second separation bar, the 10th column is the Civilian Population Increase from the entry 12 months prior.
The 11th column is the Labor Force Increase from the entry 12 months prior.
The 12th column is the Actually Fully Employed Increase from the entry 12 months prior.
The 13th column is the amount that the 12th column exceeds the 10th column, or the amount of Unemployed that is being chipped away, despite manipulation of other figures.
Figures in thousands.
Mo/Yr AcEmpl NtEm CiviPop LbrFrc Prtc% | CPIn LFIn AEInc
Jan94 114938 41.3% 195953 129393 66.0% |
Jan95 117923 40.4% 197753 130698 66.1% | 1800 1305 02985/+1185
Jan96 119023 40.4% 199634 131396 65.8% | 1881 0698 01100/-0781
Jan97 122046 39.7% 202285 134317 66.4% | 2651 2921 03023/+0372
Jan98 124798 38.9% 204238 135951 66.6% | 1953 1634 02752/+0799
Jan99 127694 38.2% 206719 137943 66.7% | 2481 1992 02896/+0415
Jan00 129950 37.8% 208782 139621 66.9% | 2063 1678 02256/+0193
Jan01 130843 38.0% 210889 141049 66.9% | 2107 1428 00893/-1214
Jan02 127890 40.0% 213089 141074 66.2% | 2200 0025 -2953/-5153
Jan02 129724 40.1% 216506 143228 66.2% | 5617 2179 -1119/-6736
Jan03 130903 40.5% 219897 145301 66.1% | 3391 2073 01179/-2212
Jan04 131772 40.7% 222161 146068 65.7% | 2264 0767 00869/-1395
Jan05 133888 40.5% 224837 147125 65.4% | 2676 1057 02116/-0560
Jan06 136978 39.8% 227553 149090 65.5% | 2716 1965 03090/+0374
Jan07 139655 39.5% 230650 151924 65.9% | 3097 2834 02677/-0420
Jan08 139372 40.1% 232616 152828 65.7% | 1966 0904 -0283/-2249
Jan09 131761 43.9% 234739 153445 65.4% | 2123 0617 -7611/-9734
Jan10 127649 46.1% 236832 152957 64.6% | 2093 -488 -4112/-6205
Jan11 128572 46.1% 238704 152536 63.9% | 1872 -421 00923/-0949
Jan12 131197 45.8% 242269 153485 63.4% | 3565 0949 02625/-0940
Jan13 133107 45.6% 244663 154794 63.3% | 2394 1309 01910/-0484
Jan14 135909 45.0% 246915 154381 62.5% | 2252 -413 02802/+0550
Jan15 139427 44.2% 249723 156050 62.5% | 2808 1669 03518/+0710
Jan16 1428
NOTIFY: Y | REPLY | REPLY WITH QUOTE | PERMALINK | TOP | HOME
Lots of BS to unpack with these numbers, and I have not had time to post about them.
NOTIFY: Y | REPLY | REPLY WITH QUOTE | PERMALINK | TOP | HOME
Quote:
Originally posted by JEWELSTAITEFAN:
Updating with Jobs Report data from yesterday (Friday, 2 December):
I will refer to this set of data as Table JSF-URF-1
Jan 2002 is listed twice. First with original report data from February 2002. Second with revised data from new Census data, published in February 2003.Quote:
Originally posted by JEWELSTAITEFAN:
BLS currently defines the Want A Job category as not being part of the Labor Force.
So I will post some actual numbers and let the comparisons and discussion follow. The documented shenanigans of Obamabots deliberately refusing to Report jobless data in the months before the 2012 Election are a different matter, I will just use the Fake Data they produced and pretend it was real.
I will use only the Unadjusted numbers, to help maintain clarity and transparency.
Mo/Yr Unemp Pcnt WAJb Pcnt SubTtl Pcnt InvPT Pcnt Total Prcnt CivPop LbrFrc Prtc% U-6
Jan98 07069 05.2% 5026 3.7% 12095 08.9% 4090 3.0% 16185 11.9% 204238 135951 66.6 09.3
Jan99 06604 04.8% 4800 3.5% 11404 08.3% 3645 2.6% 15049 10.9% 206719 137943 66.7 08.5
Jan00 06316 04.5% 4354 3.1% 10670 07.6% 3355 2.4% 14025 10.0% 208782 139621 66.9 07.8
Jan01 06647 04.7% 4474 3.2% 11121 07.9% 3559 2.5% 14680 10.4% 210889 141049 66.9 08.1
Jan02 08935 06.3% 4872 3.5% 13807 09.8% 4249 3.0% 18056 12.8% 213089 141074 66.2 10.5
Jan02 09051 06.3% 4938 3.4% 13989 09.8% 4453 3.1% 18442 12.9% 216506 143228 66.2 10.5
Jan03 09395 06.5% 4779 3.3% 14174 09.8% 5003 3.4% 19177 13.2% 219897 145301 66.1 11.0
Jan04 09144 06.3% 4913 3.4% 14057 09.6% 5152 3.5% 19209 13.2% 222161 146068 65.7 10.9
Jan05 08444 05.7% 5136 3.5% 13580 09.2% 4793 3.3% 18373 12.5% 224837 147125 65.4 10.2
Jan06 07608 05.1% 5095 3.4% 12703 08.5% 4513 3.0% 17216 11.5% 227553 149090 65.5 09.2
Jan07 07649 05.0% 4633 3.0% 12282 08.1% 4620 3.0% 16902 11.1% 230650 151924 65.9 09.1
Jan08 08221 05.4% 4977 3.2% 13198 08.6% 5235 3.5% 18433 12.1% 232616 152828 65.7 09.9
Jan09 13009 08.5% 5866 3.8% 18875 12.3% 8675 5.7% 27550 18.0% 234739 153445 65.4 15.4
Jan10 16147 10.6% 6108 4.0% 22255 14.6% 9161 5.9% 31416 20.5% 236832 152957 64.6 18.0
Jan11 14937 09.8% 6643 4.3% 21580 14.1% 9027 6.0% 30607 20.1% 238704 152536 63.9 17.3
Jan12 13541 08.8% 6495 4.3% 20036 13.1% 8747 5.7% 28783 18.8% 242269 153485 63.4 16.2
Jan13 13181 08.5% 6781 4.4% 19962 12.9% 8506 5.5% 28468 18.4% 244663 154794 63.3 15.4
Jan14 10855 07.0% 6508 4.2% 17363 11.2% 7617 5.0% 24980 16.2% 246915 154381 62.5 13.5
Jan15 09498 06.1% 6467 4.1% 15965 10.2% 7125 4.6% 23090 14.8% 249723 156050 62.5 12.0
Jan16 08309 05.3% 6166 3.9% 14475 09.2% 6234 4.0% 20709 13.2% 252397 157347 62.3 10.5
Jan17 08149 05.1% 5934 3.8% 14083 08.9% 6127 3.8% 20210 12.7% 254082 158676 62.5 10.1
Jan18 07189 04.5% 5364 3.3% 12553 07.8% 5380 3.4% 17933 11.2% 256780 160037 62.3 08.9
Jan19 07140 04.4% 5435 3.4% 12575 07.8% 5543 3.4% 18118 11.2% 258239 162104 62.8 08.8
Jan20 06504 04.0% 5107 3.1% 11611 07.1% 4605 2.8% 16216 09.9% 259502 163497 63.0 07.7
Jan21 10851 06.8% 7129 4.5% 17980 11.3% 6284 3.9% 24264 15.2% 26085
NOTIFY: Y | REPLY | REPLY WITH QUOTE | PERMALINK | TOP | HOME
Quote:
Originally posted by JEWELSTAITEFAN:
Updating with today's Jobs Report to this Table of Data, which seems to best show the components of U6:
I will refer to this set of data as Table JSF-URF-2
Note: this year the Marginally Attached data is in Table A-16 of the report.Quote:
I will post some actual numbers and let the comparisons and discussion follow. The documented shenanigans of Obamabots deliberately refusing to Report jobless data in the months before the 2012 Election are a different matter, I will just use the Fake Data they produced and pretend it was real.
The BLS uses both Seasonally Adjusted figures and Unadjusted figures, and interchanges them without clearly identifying so. For example, the current Rate of 4.1% (for 4 months straight) is SeasAdj, and the real Rate is 4.5% for Jan 2018. I will use only the Unadjusted numbers, to help maintain clarity and transparency.
Some numbers may have a 0 placed as first digit, to maintain column form in this format.
The 1st column of numbers is the unemployed. The 2nd column is the Rate.
The 3rd column is what is called Marginally Attached to the Labor Force, which is included in the Want A Job Now category but NOT included in the Labor Force category and therefore excluded from the reported Unemployment category. The 5th column is the sum of Unemployed plus Marginally Attached - which more accurately represents the Actual Unemployed. The 6th column is the Rate for column 5 figure.
The 7th column is the Involuntary Part-Time workers, who are Not Employed Full Time due to poor Economy, and want, are able to work FT. The 8th column is the Rate for column 7. The 9th column is the sum of the 5th column plus 7th column. 10th column is the Rate for column 9 figure. The Rates in columns 2, 4, 6, 8, 10 have the denominator of Labor Force.
The 11th column is the Civilian Population. 12th column is Labor Force, 13th column is Participation Rate. 14th column is the published U-6 figure.
Figures in thousands.
MoYr Unemp Pct MrgAt Pct SbTtl Pct InvPT Pct Total Pcnt CivPop LbrFrc Prtc% U6%
Ja93 09911 07.9 2120 1.6 11612 09.0 6181 4.9 16575 12.8 192644 126034 65.4
Ja94 09492 07.3 2120 1.6 11612 09.0 4963 3.8 16575 12.8 195953 129393 66.0
Ja95 08101 06.2 1783 1.4 09884 07.6 4620 3.5 14504 11.1 197753 130698 66.1
Ja96 08270 06.3 1737 1.3 10007 07.6 4103 3.1 14110 10.7 199634 131396 65.8 10.8
Ja97 07933 05.9 1615 1.2 09548 07.1 4338 3.2 13886 10.3 202285 134317 66.4 10.4
Ja98 07069 05.2 1479 1.1 08548 06.3 4090 3.0 12638 09.3 204238 135951 66.6 09.3
Ja99 06604 04.8 1358 1.0 07962 05.8 3645 2.6 11607 08.4 206719 137943 66.7 08.5
Ja00 06316 04.5 1197 0.9 07513 05.4 3355 2.4 10868 07.8 208782 139621 66.9 07.8
Ja01 06647 04.7 1290 0.9 07937 05.6 3559 2.5 11496 08.2 210889 141049 66.9 08.1
Ja02 08935 06.3 1509 1.1 10444 07.4 4249 3.0 14693 10.4 213089 141074 66.2 10.5
Ja02 09051 06.3 1532 1.1 10583 07.4 4453 3.1 15036 10.5 216506 143228 66.2 10.5
Ja03 09395 06.5 1598 1.1 10993 07.6 5003 3.4 15996 11.0 219897 145301 66.1 11.0
Ja04 09144 06.3 1670 1.1 10814 07.4 5152 3.5 15966 10.9 222161 146068 65.7 10.9
Ja05 08444 05.7 1804 1.2 10248 07.0 4793 3.3 15041 10.2 224837 147125 65.4 10.2
Ja06 07608 05.1 1644 1.1 09252 06.2 4513 3.0 13765 09.2 227553 149090 65.5 09.2
Ja07 07649 05.0 1577 1.0 09226 06.1 4620 3.0 13846 09.1 230650 151924 65.9 09.1
Ja08 08221 05.4 1729 1.1 09950 06.5 5235 3.4 15185 09.9 232616 152828 65.7 09.9
Ja09 13009 08.5 2130 1.4 15139 09.9 8675 5.6 23814 15.5 234739 153445 65.4 15.4
Ja10 16147 10.6 2539 1.6 18686 12.2 9161 6.0 27847 18.2 236832 152957 64.6 18.0
Ja11 14937 09.8 2800 1.8 17737 11.6 9027 5.9 26764 17.5 238704 152536 63.9 17.3
Ja12 13541 08.8 2809 1.9 16350 10.7 8747 5.7 25097 16.4 242269 153485 63.4 16.2
Ja13 13181 08.5 2443 1.6 15624 10.1 8506 5.5 24130 15.6 244663 154794 63.3 15.4
NOTIFY: Y | REPLY | REPLY WITH QUOTE | PERMALINK | TOP | HOME